What is Z-Test?
Z-Test is a statistical test which let’s us approximate the distribution of the test statistic under the null hypothesis using normal distribution.
Z-Test is a test statistic commonly used in hypothesis test when the sample data is large.For carrying out the Z-Test, population parameters such as mean, variance, and standard deviation should be known.
This test is widely used to determine whether the mean of the two samples are different when the variance is known. We make use of the Z score and the Z table for running the Z-Test.
Z-Test as Hypothesis Test
A test statistic is a random variable that we calculate from the sample data to determine whether to reject the null hypothesis. This random variable is used to calculate the P-value, which indicates how strong the evidence is against the null hypothesis. Z-Test is such a test statistic where we make use of the mean value and z score to determine the P-value. Z-Test compares the mean of two large samples taken from a population when the variance is known.
Z-Test is usually used to conduct a hypothesis test when the sample size is greater than 30. This is because of the central limit theorem where when the sample gets larger, the distributed data graph starts resembling a bell curve and is considered to be distributed normally. Since the Z-Test follows normal distribution under the null hypothesis, it is the most suitable test statistic for large sample data.
Why do we use a large sample for conducting a hypothesis test?
In a hypothesis test, we are trying to reject a null hypothesis with the evidence that we should collect from sample data which represents only a portion of the population. When the population has a large size, and the sample data is small, we will not be able to draw an accurate conclusion from the test to prove our null hypothesis is false. As sample data provide us a door to the entire population, it should be large enough for us to arrive at a significant inference. Hence a sufficiently large data should be considered for a hypothesis test especially if the population is huge.
How to Run a Z-Test
Z-Test can be considered as a test statistic for a hypothesis test to calculate the P-value. However, there are certain conditions that should be satisfied by the sample to run the Z-Test.
The conditions are as follows:
- The sample size should be greater than 30.
This is already mentioned above. The size of the sample is an important factor in Z-Testing as the Z-Test follows a normal distribution and so should the data. If the same size is less than 30, it is recommended to use a t-test instead
- All the data point should be independent and doesn’t affect each other.
Each element in the sample, when considered single should be independent and shouldn’t have a relationship with another element.
- The data must be distributed normally.
This is ensured if the sample data is large.
- The sample should be selected randomly from a population.
Each data in the population should have an equal chance to be selected as one of the sample data.
- The sizes of the selected samples should be equal if at all possible.
When considering multiple sample data, ensuring that the size of each sample is the same for an accurate calculation of population parameters.
- The standard deviation of the population is known.
The population parameter, standard deviation must be given to run a Z-Test as we cannot perform the calculation without knowing it. If it is not directly given, then it assumed that the variance of the sample data is equal to the variance of the entire population.
If the conditions are satisfied, the Z-Test can be successfully implemented.
Following are steps to run the Z-Test:
- State the null hypothesis
The null hypothesis is a statement of no effect and it supports the data which is already given. It is generally represented as :
H0:µ = k
- State the alternate hypothesis
The statement that we are trying to prove is the alternate hypothesis. It is represented as:
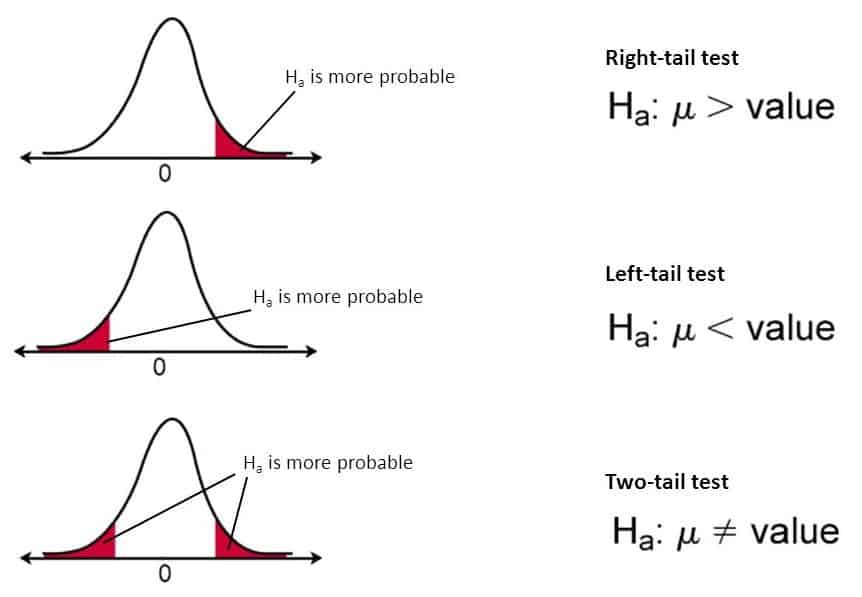
- H1:µ ≠ k
This is the representation of a bidirectional alternate hypothesis.
- H1:µ > k
This is the representation of a one-directional alternate hypothesis that is represented in the right region of the graph.
- H1:µ < k
This is the representation of a one-directional alternate hypothesis that is represented in the left region of the graph.
- Choose an alpha level for the test.
Alpha level or significant level is the probability of rejecting the null hypothesis when it is true. It is represented by ( α ). An alpha level must be chosen wisely so as to avoid the Type I and Type II errors.
If we choose a large alpha value such as 10%, it is likely to reject a null hypothesis when it is true. There is a probability of 10% for us to reject the null hypothesis. This is an error known as the Type I error.
On the other hand, if we choose an alpha level as low as 1%, there is a chance to accept the null hypothesis even if it is false. That is we reject the alternate hypothesis to favor the null hypothesis. This is the Type II error.
Hence the alpha level should be chosen in such a way that the chance of making Type I or Type II error is minimal. For this reason, the alpha level is commonly selected as 5% which is proven best to avoid errors.
- Determining the critical value of Z from the Z table.
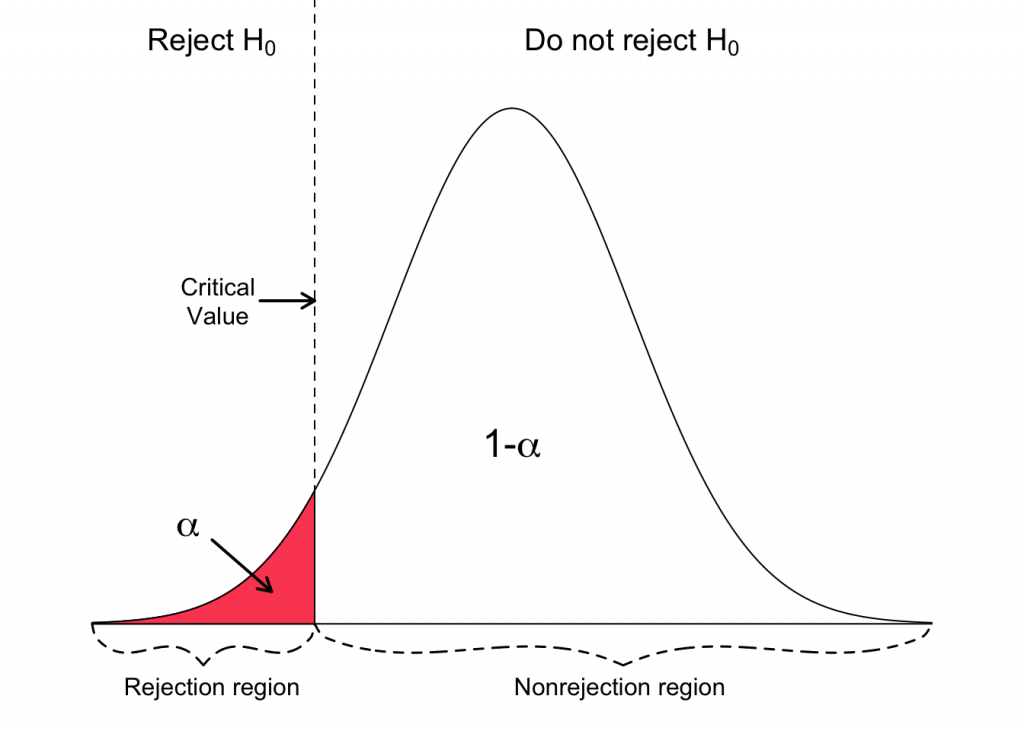
The critical value is the point in the normal distribution graph that splits the graph into two regions: the acceptance region and the rejection regions. It can be also described as the extreme value for which a null hypothesis can be accepted. This critical value of Z can be found from the Z table.
- Calculate the test statistic.
The sample data that we choose to test is converted into a single value. This is known as the test statistic. This value is compared to the null value. If the test statistic significantly differs from the null value, the null value is rejected.
- Comparing the test statistic with the critical value.
Now, we have to determine whether the test statistic we have calculated comes under the acceptance region or the rejection region. For this, the test statistic is compared with the critical value to know whether we should accept or reject a null hypothesis.
Types of Z-Test
Z-Test can be used to run a hypothesis test for a single sample or to compare the mean of two samples. There are two common types of Z-Test
One-Sample Z-Test
This is the most basic type of hypothesis test that is widely used. For running an one-sample Z-Test, all we need to know is the mean and standard deviation of the population. We consider only a single sample for a one-sample Z-Test. One-sample Z-Test is used to test whether the population parameter is different from the hypothesized value i.e whether the mean of the population is equal to, less than or greater than the hypothesized value.
The equation for finding the value of Z is:
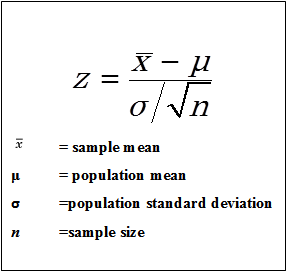
The following are the assumptions that are generally taken for a one-sampled Z-Test:
- The sample size is equal to or greater than 30.
- One normally distributed sample is considered with the standard deviation known.
- The null hypothesis is that the population mean that is calculated from the sample is equal to the hypothetically determined population mean.
Two-Sample Z-Test
A two-sample Z-Test is used whenever there is a comparison between two independent samples. It is used to check whether the difference between the means is equal to zero or not. Suppose if we want to know whether men or women prefer to drive more in a city, we use a two-sample Z-Test as it is the comparison of two independent samples of men and women.
The equation for finding the value of Z is:
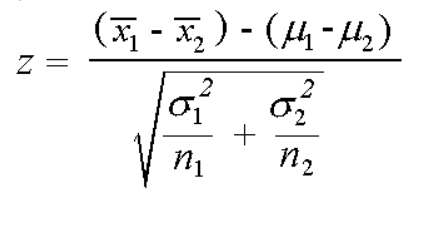
Where
- x1 and x2 represent the mean of the two samples.
- µ1 and µ2 are the hypothesized mean values.
- σ1 and σ2 are the standard deviations.
- n1 and n2 are the sizes of the samples.
The following are the assumptions that are generally taken for a two-sample Z-Test:
- Two independent, normally distributed samples are considered for the Z-Test with the standard deviation known.
- Each sample is equal to or greater than 30.
- The null hypothesis is stated that the population mean of the two samples taken does not differ.
Critical value
A critical value is a line that splits a normally distributed graph into two different sections. Namely the ‘Rejection region’ and ‘Acceptance region’. If your test value falls in the ‘Rejection region’, then the null hypothesis is rejected and if your test value falls in the ‘Accepted region’, then the null hypothesis is accepted.
Critical Value Vs Significant Value
Significant level, alpha is the probability of rejecting a null hypothesis when it is actually true. While the critical value is the extreme value up to which a null hypothesis is true. There migh come a confusion regarding both of these parameters.
Critical value is a value that lies in critical region. It is in fact the boundary value of the rejection region. Also, it is the value up to which the null hypothesis is true. Hence the critical value is considered to be the point at which the null hypothesis is true or is rejected.
Critical value gives a point of extremity whose probability is indicated by the significant level. Significant level is pre-selected for a hypothesis test and critical value is calculated from this Alpha value. Critical value is a point represented as Z score and Significant level is a probability.
Z-Test Vs T-Test
Z-Test are used when the sample size exceeds 30. As Z-Test follows normal distribution, large sample size can be taken for the Z-Test. Z-Test indicates the distance of a data point from the mean of the data set in terms of standard deviation. Also. this test can only be used if the standard deviation of the data set is known.
T-Test is based on T distribution in which the mean value is known and the variance could be calculated from the sample. T-Test is most preferred to know the difference between the statistical parameters of two samples as the standard deviation of the samples are not usually given in a two-sample test for running the Z-Test. Also, if the sample size is less than 30, T-Test is preferred.