What is Standard Deviation?
Standard deviation is the dispersion of elements in the dataset relative to its mean value. Variance is the measure of how spread out the elements are. Whereas standard deviation is used commonly in statistics when mean is used to calculate central tendency. Hence, variance and standard deviation have the same symbol (S). Standard deviation can be expressed as the square root of the variance.
In statistics, we generally calculate the parameters that define a population. As the population has all the data that need to know for accurate calculations, there is lesser chance for errors to occur as we can easily cross-check. The population parameters such as standard deviation and variance can be calculated if:
- The entire population is given.
- A sample of a large population is given.
What is the Sample Standard Deviation & When is it used?
Usually, we are more interested in calculating the standard deviation of the entire population. But often this population is simply too large to consider each and every element in it or is simply unknown or not feasible.
For example, assume that we have to find out the standard deviation of the weight of the newborn babies in a country. It is nearly impossible to weigh every newborn in the country. In this case, we select a dataset of a large number of babies and weigh them. From this result, we estimate the standard deviation of the entire population of newborn babies.
Hence sample standard deviation is used over population standard deviation when we are left to find the population parameters with a limited amount of knowledge of the population. That is, instead of taking the whole population, we take a sample of data from it. The elements in the population are selected randomly to create sample data. This sample data must be large enough to represent the population if the population size is huge. The larger the sample size, the better its representation of the corresponding population. Now, once the sample is selected we try to interpret the population parameters using it. We estimate the population parameters with a sample drawn from it. Sample standard deviation is one of these estimations.
Sample Standard Deviation Definition & Symbol
Sample standard deviation is the estimation of the population standard deviation from a sample that is drawn from it. It is not the standard deviation value of the sample itself. This is an essential point to note. Sample standard deviation is the estimation of the population standard deviation based on the sample that is drawn from the population. In the calculation of the sample standard deviation, we consider the sample given to us as a part of a large population, and we are looking for the standard deviation value for the entire population. We are interested in the large population and not the sample itself. The sample standard deviation is represented by S.
There will be sampling errors while calculating the population parameters from samples. For reducing these errors:
- The elements must be chosen at random. Every element should have an equal probability of getting chosen.
- The sample size should be increased.
Sample Standard Deviation Formula
The formula for finding the sample standard deviation is :
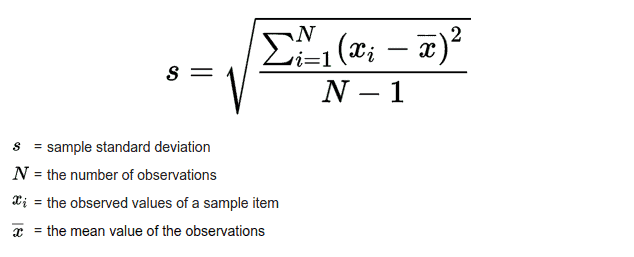
The steps in the calculation of the sample standard deviation are as follows:
- Select the sample.
The sample must be selected by taking random elements from the population. All the elements must be independently chosen and choosing one element should not increase or decrease the probability of choosing any other element. This is essential to reduce sampling errors.
- Determine the sample size.
The sample size is the number of elements in the sample. It is denoted by N in the equation. If the sample size is large, we are provided with more information about the population and hence the errors can be reduced.
- Work out the value of the sample mean.
We have to know the value of the mean of the sample to calculate the standard deviation. Here, we are calculating the sample mean value. That is, an estimation of the population mean drawn from the sample. The sample mean is represented by ( x̄ ). The equation for calculating the sample mean is:
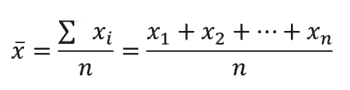
Where:
- x1, x2, x3, ….. xn is the elements in the sample
- N is the number of elements, that is the sample size.
- Calculate the squared differences of each element from the sample mean.
Once the mean is calculated for the sample, it is subtracted from each and every element present in the sample. Once this is done we might have a collection of differences which might be positive, negative, or zero. For an accurate calculation, we square each of these differences. Now, we are left with N number of squared differences of the elements from the mean value.
The squared differences can be represented as :
(x1 –x̄)2 , (x2 – x̄)2, …… (xn – x̄)2
- Calculate the square root of the mean of the squared differences.
Sample standard deviation is essentially the root of the mean of the squared differences of the elements. So the final step is to calculate the mean of the squared differences and taking its square root. There is one important point to notice here. The sample size is taken as one less than the actual sample size. That is one is subtracted from the sample size of N. This is done according to Bessel’s correction.
Bessel’s Correction & Sample Sizes
As we are estimating population parameters with the help of sample parameters, the chances of making errors are high, especially if the sample size is low or the corresponding population size is high. Since we are taking the sample mean which has some degree of error and not exactly equal to the actual population mean, the elements will be more close to the sample mean than it might be to the actual population mean. Thus, the squared differences will be smaller. If we take the sample size as N, it will lead to a disproportion where the numerator is smaller than what it is supposed to be, and this will ultimately result in a standard deviation value which will be smaller than the actual value. Hence to reduce the effect of this disproportion in the numerator, we subtract one from the sample size with aim of decreasing the size of the denominator so as to produce a larger value from the equation.
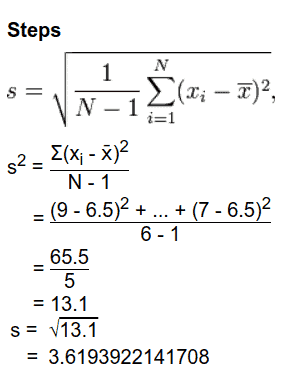
Sample Standard Deviation Example
Question: A teacher conducted a class test in a class of 20 students. She wanted to know the average marks scored by the students and also how much the marks deviated from the average marks. She selected the marks of 6 students at random and decided to analyze the performance of the entire class from it.
The marks of the students she selected are as follows: 9, 2, 5, 4, 12, 7.
Solution: Let us calculate the sample standard deviation of the sample given to us step by step.
Step 1: To select the sample
Sample given is: 9, 2, 5, 4, 12, 7
Step 2: Determine the sample size
Sample size = N = 6
Step 3: Work out the sample mean value
Sample Mean value x̄ = ( 9 + 2 + 5 + 4 + 12 + 7 ) / 6 = 39 / 6 = 6.5 marks
Step 4: Calculate the squared differences of each element.
| x | x – x̄ | ( x – x̄)2 |
| 9 | 2.5 | 6.25 |
| 2 | -4.5 | 20.25 |
| 5 | -1.5 | 2.25 |
| 4 | -2.5 | 6.25 |
| 12 | 5.5 | 30.25 |
| 7 | 0.5 | 0.25 |
Step 5: Take the root of the mean of the squared differences.
Sum of the squared differences = 6.25 + 20.25 + 2.25 + 6.25 + 30.25 + 0.25 = 65.5
According to Bessel’s Correction, N-1 = 6 – 1 = 5
Dividing the sum of squared difference by 5, we get = 65.5 / 5 = 13.1 square marks.
This is the sample variance of the marks.
Sample standard deviation = square root of sample variance = ( 13.1) ^ ( ½ ) = 3.619 marks.
That is the marks of the students have an estimated standard deviation of 3.619 units from the mean marks of 6.5.
What is the Population Standard Deviation?
As already discussed the population parameters can be calculated by two methods: either by taking the entire population or by estimating the parameters from a sample statistics. Though the latter is easy to apply, the former is the best way to calculate the parameters of the population.
When we consider the entire population, and not a sample, we can directly calculate the parameters. So far we have been calculating, or rather estimating the population parameters with the help of a sample taken randomly from it. We assume the sample statistics as the population parameters. This practice will lead to the probability of occurring errors. But if we have the dataset as a whole, making errors is minimal and we can easily cross-check if there is any.
Population standard deviation calculates the standard deviation of the given dataset. All the elements are given. We are not estimating or assuming anything here. Our calculation and concern are limited to the dataset alone. We do not have to look beyond the dataset. Every information we need for the calculation is provided to us.
The population standard deviation is also called a root mean square value as we are taking the root of the mean of the squared difference of an element from the mean value. The population standard deviation is a parameter that is calculated from every element in a population and it is a fixed value. If the elements are more spread out, the standard deviation will have a higher value. If the elements are close together, then the standard deviation value will be small.
Population Standard Deviation & the Normal Distribution
The standard deviation can be understood from a bell curve or a normal distribution. The normal distribution is a probability distribution that shows the spread of the values of a variable.
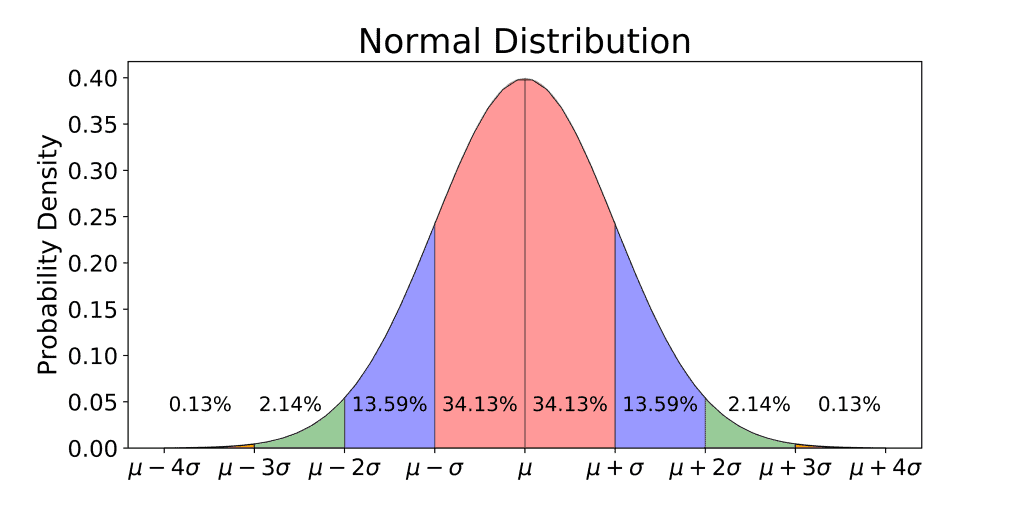
The population mean value is represented by the greek letter (µ). In a normal distribution, this is located at the peak of the graph, at the center. The population standard deviation is represented by the greek letter (σ). Each segment in the graph represents the elements that are one standard deviation away from the mean. We can also see that 68.2% of the total elements deviate from the mean value by a maximum of one unit of standard deviation. This is in accordance with the empirical rule.
The empirical rule states that in a normal distribution, 99.7% of the elements fall within 3 standard deviations from the mean value. It is also known as three-sigma rule or 68-95-99.7 rule that states:
- 68% of the elements fall within 1 standard deviation away from the mean.
- 95% of elements fall within 2 standard deviations away from the mean
- 99.7% of elements fall within 3 standard deviations away from the mean value of the dataset.
By the empirical rule, only 0.2% of the elements are found more than 3 standard deviations away from the mean value. Thus, the occurrence of elements that are more than 3 standard deviations away from the mean is negligible. This makes sense as the mean value will be usually close to the frequently occurring values of the elements. Hence the bell shape.
Population Standard Deviation Formula
The formula for calculating the population standard deviation is:
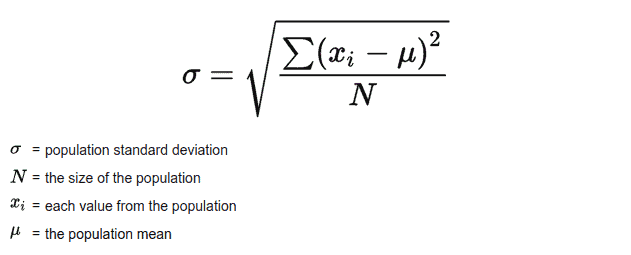
The population standard deviation can be calculated by the following steps:
- Determine the population.
We do not have to select a sample here. The entire population is determined here. A population is a set of data that have some similarity and something on which an experiment is performed. If we have to know the average age of children in a housing colony, then the population will consist of all the children in the area. If we want to know the performance of students in a class, all the students form the population.
- Determine the size of the population.
The number of elements of a population is represented by N. Usually the population size is too large to consider every element of a population. Hence the application of determining the population standard deviation by considering all the elements in the population is limited. But if the population size is not so large and is practically considerable, population standard deviation can be calculated without the help of sample statistics.
- Work out the population mean value.
While the sample mean value is the estimated population mean value in a sample statistics, the exact population mean value can be calculated by the following formula:
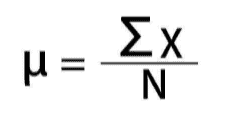
Where:
- µ = the population mean value
- N = the size of the entire population
- X = the elements in the population
- Calculate the squared differences of each element from the sample mean.
Now, as the next step, we subtract the value of the population mean from each element in the population and square it. Here also, we square the difference to remove the negative differences and to make the calculation correct.
- Calculate the mean value of the squared differences and take its square root to get the population standard deviation value.
Now, we add all the squared differences and divide it by the population size N. The result will be the population variance. Finally, by taking the root of the population variance we will get the population standard deviation.
Bessel’s Correction & Population Standard Deviation
Here, there is no applicability for Bessel’s correction. We do not subtract one from the total population size. This is because we are taking the population mean for taking the squared difference and not the sample mean value, which might have some degree of error. We subtract one from the sample size in the calculation of sample standard deviation because the elements tend to be closer to the sample mean value than it actually is to the population mean value. To balance the disproportion caused by this calculation, we decrease the denominator value. By considering the actual population mean, the probability of making an error has been already eliminated. As previously mentioned, the chances of making an error in calculating the population parameter when the whole of the information associated with a population is provided is negligible and we can easily cross-check if it occurs.
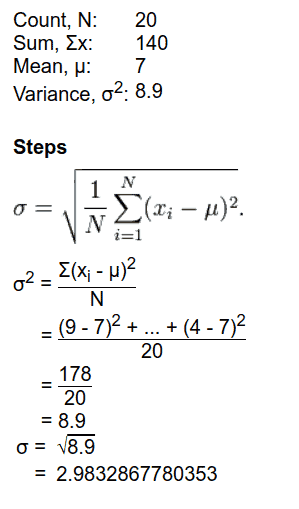
Population Standard Deviation Example.
Question: Let us take the same example that we took for the sample standard deviation calculation. Let us say that the teacher decided to consider the marks of all 20 students to analyze the performance of the class. Now, the teacher takes the entire population while she took a sample of data the previous time. Let us look at the result after this calculation.
The marks of the 20 students are as follows: 9, 2, 5, 4, 12, 7, 8, 11, 9, 3, 7, 4, 12, 5, 4, 10, 9, 6, 9, 4
Solution:
As done previously, let us solve the problem step by step:
Step 1: Determine the population.
The marks of the population of students = 9, 2, 5, 4, 12, 7, 8, 11, 9, 3, 7, 4, 12, 5, 4, 10, 9, 6, 9, 4
Step 2: Determine the size of the population.
There are 20 students in the class. As we are taking the marks of all the students the population size is also equal to 20.
N = 20
Step 3: Work out the population mean
The population mean (µ) = ( 9 + 2 + 5 + 4 + 12 + 7 + 8 + 11 + 9 + 3 + 7 + 4 + 12 + 5 + 4 + 10 + 9 + 6 + 9 + 4 ) / 20
µ = 140 / 20 = 7
Step 4: Calculate the squared differences of each element from the population mean.
| X | X – µ | ( X – µ )2 |
| 9 | 2 | 4 |
| 2 | -5 | 25 |
| 5 | -2 | 4 |
| 4 | -3 | 9 |
| 12 | 5 | 25 |
| 7 | 0 | 0 |
| 8 | 1 | 1 |
| 11 | 4 | 16 |
| 9 | 2 | 4 |
| 3 | -4 | 16 |
| 7 | 0 | 0 |
| 4 | -3 | 9 |
| 12 | 5 | 25 |
| 5 | -2 | 4 |
| 4 | -3 | 9 |
| 10 | 3 | 9 |
| 9 | 2 | 4 |
| 6 | -1 | 1 |
| 9 | 2 | 4 |
| 4 | -3 | 9 |
Step 5: Calculating the root mean square value of the squared differences.
The sum of the squared difference = 4 + 25 + 4 + 9 + 25 + 0 +1 + 16 + 4 + 16 + 0 + 9 + 25 + 4 + 9 + 9 + 4 + 1 + 4 + 9 = 178
Next, divide this sum by the population size, N = 20.
Mean of squared difference = 178 / 20 = 8.9
This is the population variance of the population.
By taking the square root of the population variance, we get the population standard deviation.
The population standard deviation = square root of the population variance = σ = ( 8.9 )1/2
σ = 2.983 marks.
That is, the marks of the students deviate by 2.983 units from the population mean.