Hypothesis & Hypothesis Testing
‘Hypothesis’ is an educated guess about anything which can be tested or observed. A hypothesis can be defined as an assumption made based on evidence.
In statistics, hypothesis is the assumption that we make regarding population parameters from the sample statistics and the testing of the credibility of the same is known as hypothesis testing.
A hypothesis statement usually consists of an independent variable and a dependent variable in which the change in the dependent variable with respect to the change in the independent variable can be observed.
Examples of a hypothesis statement can be as follows:
- If I study more, I will get good marks.
- If I drink coffee, I will be able to concentrate more.
A hypothesis test is used to test the relation between two research variables. A hypothesis statement is proved true or false by the hypothesis test. It is used to know about a population by taking sample data. These sample data are randomly taken from a large population whose parameters could not be easily calculated.
(As often happens in real life, a population can be too large to perform any mathematical operations, and direct calculation of the population parameters can be practically difficult. For instance, if we have to know the ratings of a product from the people in a country, we cannot possibly take the ratings of each individual and then come to the conclusion. Instead, we randomly select a group of people who could be treated as a sample representing the entire population. This process will make the calculation a lot easier and faster and more importantly, feasible.)
A hypothesis test will have two statements that are mutually exclusive. The sample data helps us to conclude which of the two assumed population parameters is true. The two mutually exclusive hypothesis are the null hypothesis and the alternate hypothesis.
Hypothesis testing looks for any sort of difference or effect in a population parameter. If there is no difference between the sample data observations and the population parameters, then it favors the null hypothesis.
On the other hand, if there is any proof in the sample data inference that changes the null hypothesis value, then the test favors the alternate hypothesis value.
A hypothesis test is usually carried out to contradict the null hypothesis. However, the alternate hypothesis favored result of a sample data might be due to chance and does not necessarily affect the population parameters. We have to know if the effect is significant or meaningful or it occurred by chance. The hypothesis test considers this probability of making errors as well.
There are 4 major steps in hypothesis testing:
- Stating the two mutually exclusive statements.
- Formulating an analysis plan to carry out the test.
- Carry out the test
- Analyzing the result and based on it, accept or reject the null hypothesis.
Types of Hypothesis
There are different types of hypothesis:
- Simple hypothesis: Simple hypothesis defines the relationship between one dependent variable and a single independent variable. The above two examples are simple hypothesis.
- Complex hypothesis: Complex hypothesis defines the relationship between more than one independent and dependent variables. For example, ‘the consumption of junk food and lack of exercise will lead to weight gain, obesity, and health problems’ is a complex hypothesis statement.
- Directional hypothesis: Directional hypothesis defines the relationship between the variables as well as their nature. It shows the direction of the effect.
- Null hypothesis: A contradictory statement that states there is no relationship between the variables.
What is the Null Hypothesis?
It is a negative statement which states that there is no relationship between the dependent and the independent variable. In every experiment, the researchers work to disprove, reject, and contradict the null hypothesis.
Suppose in an experiment we are experimenting with the relationship between the amount of coffee consumption of people and their concentration level, our alternate hypothesis will be that there is a connection between them. But the null hypothesis in this experiment will be that there is no relation between the concentration level of people and their coffee consumption at all. As it is clearly seen, the alternate hypothesis is the exact opposite of the null hypothesis. That is, they are mutually exclusive.
The null hypothesis is the accepted population parameters. Null hypothesis is represented by the symbol H0 which can be read as H-null, H-zero, or H-naught. It is often associated with equal to sign as there is no approximation or uncertainty in this statement.
A null hypothesis is useful in all the experiments as it can be tested to know whether any relationship is there between the dependent variable and the independent variable. It also helps to advance a theory. Also, it is useful to test whether the results obtained after the test is significant or due to chance.
The null hypothesis is a statement based on some evidence that is not strong enough to ultimately make it true without any doubt. We need to prove that this statement, drawn from the available data is absolutely true by further testing. We can only reject the null hypothesis if the evidence we produce after the test is significant and strong, eliminating any possible statements that suggest the possibility of error.
There are different types of null hypothesis:
- Simple hypothesis: it absolutely defines and specifies the population. The sample distribution in this case will be a function of the sample size, N.
- Composite hypothesis: it does not specify the population distribution completely.
- Exact hypothesis: defines the exact value of the parameter.
- Inexact hypothesis: specifies a range or interval rather than a definite value.
How Null Hypothesis Works?
As previously mentioned, a null statement must be proved correct through further tests. Assuming that the null hypothesis is true, we collect data and determine the probabilities of the collected data of a random sample. This forms the principle of the null hypothesis.
After the analysis, if the observations and results are not sufficient or strong enough to support the null hypothesis, it can be rejected. On the other hand, if the evidence is reliable and supports the null hypothesis, it is accepted.
The result of the experiment after the analysis of the data is treated as evidence against either the null hypothesis or the alternate hypothesis. We don’t have to believe that the null hypothesis is absolutely true or false to conduct the research. We just have to assume that there might be some relationship between the variables that are analyzed.
Some statistical tools are used in the testing of the null hypothesis where the data is analyzed to know the extend of deviation of the data from the null hypothesis. However, in some cases, the evidence doesn’t contradict the null statement strongly. In such cases, where we would not be sure whether the null hypothesis is true or false, we often accept it as true.
In simpler terms, we only reject the null hypothesis if the evidence strongly supports the alternate hypothesis. If the evidence is weak, it means that the experiment simply fails to prove the relationship of the phenomenon. Thus, the reliability of the evidence is of the utmost importance.
Also, it is important to note that the null hypothesis cannot be proven true by research and experiment. We can accept it as true until any reliable evidence come up to contradict it. We cannot mathematically prove that the null hypothesis is true absolutely. When we accept the null hypothesis we are actually proving that the alternate hypothesis is not true and therefore we accept the null hypothesis as true. Similarly, if the alternate hypothesis is proven true, we can certainly reject the null hypothesis proving that it is false.
Now why consider a null hypothesis at all? If we are only interested to prove the relationship between the variables, why we bother to state a null hypothesis? The answer is that when we do a scientific experiment, we have to systematically prove the theories, making sure that there is no flaw in the results. Stating the null hypothesis, we could enhance that the new hypothesis is tested true without any flaws. It is a systematic way to ensure that the research is not flawed.
Significant Level/Significance Value
The significant level is an important parameter in the hypothesis test. Unlike the P-value, a significant level is not calculated for a test. It is a value that is chosen for the test. The significant level is referred to as alpha.
A significant level can be defined as the measure with which we determine how strongly the sample data contradict the null. The result of the sample data gives evidence against the null hypothesis and the significant level is the parameter with which we determine it is valid or not. It is a probabilistic value. It is the probability of producing an effective result statistically when the null hypothesis is true. That is it gives the probability of rejecting the null value even when it is true. Rejecting a null value when it is true is called a Type I error. The Significant value is equal to the Type I error rate.
Hence the significant level value should be low so as to avoid making the mistake of considering the effect of sample data when it is not significant. Usually, the alpha value is chosen as 0.05. This implies that you have a 5% chance of getting an effective result even when the null hypothesis is true.
Null Hypothesis & Significant Value
Statistically, the significance of the result is analyzed by a value called a significant value. It is the probability of rejecting the null hypothesis when it is actually true. Denoted by alpha (α), it is the measure of the strength of evidence in the sample before rejecting the null hypothesis. Usually, the alpha level is taken at 5%. This means that the researcher has a 5% probability of rejecting the null hypothesis when it is correct.
Let us look at how the alpha value is used to know the significance of the effect of the data.
A hypothesis test can be carried out by calculating the P-value of the sample. It is the measure of the probability of a random occurrence of the result.
If we want to prove and accept the alternate hypothesis, we must come up with evidence suggesting that the result is reliable and it is not occurred by chance.
An experiment is conducted to favor the alternate hypothesis and contradict the null hypothesis. Hence the p-value should be low for the acceptance of the alternate hypothesis. That is, if the p-value of the sample is less than the significant value, then the evidence is strong enough to support the alternate hypothesis. It means that the result is significant. Hence the rejection of the null hypothesis.
On the other hand, if the p-value of the sample is greater than the significant value, it strongly contradicts the alternate hypothesis. It means the result is not significant. Hence it accepts the null hypothesis.
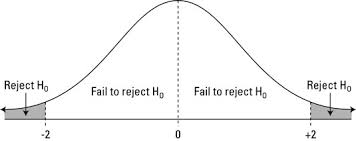
In the probability distribution graph, there is a region called the rejection region defined by the significance value, wherein the null hypothesis is rejected.
Type I and Type II Error
Type I Error: Type I Error occurs when we reject the null hypothesis when it is true. This occurs when a large value is taken as the alpha value. This can be called a false positive scenario. This error can be minimized by taking a low significance level value.
Type II Error: Type II Error is the exact opposite of Type I error. Here we do not reject the null hypothesis when it is actually false. This may occur if the alpha value is marginally low. Appropriately taking the alpha value will reduce both the Type I and Type II errors.
For example, if we take the alpha value 12%, then there is more chance to reject the null value when it is true. This would be a Type I error. However, if an alpha value as low as 1% is taken, then it is possible to accept the null value even if it is false. This is called a Type II error. Hence it is a standard measure to take the value 5% for alpha which is neither too high nor too low.
Why the Null Hypothesis is called ‘Null’?
The null hypothesis is called so because it the commonly accepted statement that researchers work to nullify or cancel. A null statement is a statement of no effect. That is, it is the statement that nullifies an effect. It does not mean that the statement itself is null. Rather, it is the statement that favors a null effect from the experiment. The null hypothesis is a statement that nullifies or cancel the relationship between the dependent and independent variable.This is where the null hypothesis is contradicting the alternate hypothesis.
Null Hypothesis vs Alternate Hypothesis
The major differences between the null hypothesis and the alternate hypothesis are as follows:
- The null hypothesis is a statement that has no effect and states that there is no relation between the dependent and the independent variable. The alternate hypothesis is a statement of effect and states that there is some relation between the variables.
- The null hypothesis is denoted by H0. the alternate hypothesis is denoted by Ha or H1.
- The null hypothesis is observed due to the result of chance. The alternate hypothesis is observed due to the result of some effect in the experiment.
- The equal sign represents the mathematical formulation of the null hypothesis. On the other hand, some inequality signs such as greater or less than are used to represent the mathematical formula of the alternate hypothesis.
- The null value is accepted only if the p-value is greater than the significance value. A smaller p-value than the significance value will support the alternate hypothesis.