A variable is a quantity whose values are measured in an experiment. It is a quantity that has no fixed value and is viable to change during the experiment. It can be any type of measurement such as time, distance, temperature, event, idea, feeling, etc.
In research, we often try to study the effect of one variable on the other. That is, we analyze the relationship between the variables. In cause and effect experiments where we study the effect of a cause of events, variables are called the independent and dependent variables. The independent variable represents the cause. It is a variable that is independent of other variables. The dependent variable is a variable that depends on the change in the value of the independent variable. It represents the effect of the cause of events in an experiment.
For example, if an experiment is conducted to know the effect of the length of time one exercises on the respective person’s weight loss, the independent variable will be the total hours of exercise and the dependent variable will be the weight lost due to the exercise since the latter is dependent on the former.
Independent Variable
The Independent variable is a variable that is changed by the experimenter in order to study the effect it has on the dependent variable. It stands alone and a direct effect on the dependent variable.
As the name indicates, the independent variable is independent and has a value that is not affected by any other factors in an experiment. The independent variable cannot be changed by any other factors in the experiment and can be controlled by the experimenter only. The type of the independent variable depends upon the experiment and research. And there can be multiple independent variables in a single experiment as well.
It is essential for an experimenter to operationally define the independent variable before the start of the experiment so that they can manipulate it to study the effect. An operational definition is the definition of the independent variable by stating exacting what is an independent variable and how it is used. This will help to systematically conduct the experiment and to clearly know what the purpose of the experiment is.
A hypothetical case is always considered for conducting the experiment. While carrying out the experiment, the changes in the independent variable might or might not cause changes in the dependent variable. The result is concluded from this observation.
It is crucial to identify the independent variable of the experiment without making mistakes.
We can identify the independent variable as:
- The variables that are manipulated or controlled by the experimenter.
- The variable whose change brings the change in the value of other variables.
- Independent of other factors and cannot be changed unless manipulated manually.
It is possible to have several independent variables in an experiment that affect the result. Identifying every factor of an experiment and accounting for the independent variable reduces the error occurrences. Independent variables find their applications in all types of research and experiments including business, finance, psychology, statistics, science and many more fields.
Example
Let us assume a research is carried out to study the relationship between the growth of the plants and the rate of watering the plant. Here, the researcher can manually change the amount of water that is being fed to the plant but the growth of the plant is something he/she could only observe. Also, watering of the plant has a direct effect on its growth. Hence, the researchers would carry out the experiment by changing the amount of water used for watering the plants and observing the changes it caused in its growth. The amount of water is not affected by any other factors in the experiment and changed by the experimenters themselves. Hence it is the independent variable in the experiment that has a direct effect on another variable.
Independent Variable on Graph
The relationship between the independent variable and the dependent variable can be plotted on a graph. A graphical representation is the best way to visualize the effect of the independent variable on the dependent variable as it does not require much explanation. The graph itself gives the required data and information and one can easily read the graph merely by looking at it.
In an experiment, the independent variable can be considered as an input for the experiment. Hence, it is plotted on the horizontal X-axis. The axis will be labeled with the name of the variable and its values that are changed by the experimenters. The effect of every change in the independent variable is plotted on the vertical Y-axis.
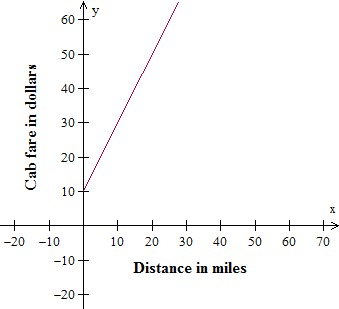
The above graph shows the relation between the cab fare and the distance it travels. Here the relation is a linear in nature such that as the distance keeps increasing the cab fare keeps increasing proportionally.
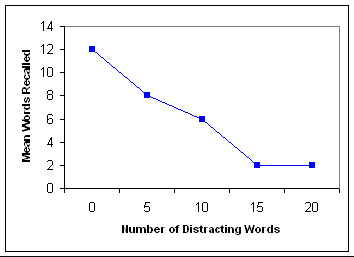
The above graph shows the relation between the mean of number of words recalled and the number of distracting words present in a passage of text. Here the relation is not linear like before. We see that as the number of distracting words increases, the mean of words recalled by the individuals decreases sharply.
Levels of Independent Variable
Independent variables can have different levels. This can be called a subtype of the independent variable.
The number of levels for an independent variable can be referred to as the number of experimental conditions. It is often called the grouping variables.
The independent variables must have at least 2 levels and usually not more than 5.
Suppose if we have to know how many people consume tea and coffee, the independent variable here is defined as the beverage that the people consume with 2 levels: tea and coffee. Now, if we want to know the number of balls in a box containing blue, red, yellow, and green balls, color is the independent variable here with a level of 4.
The experimenter carries out these experiments to know the difference a factor brings upon another factor by comparing different groups that are different only on one factor. This way, any change in the result observed by the experimenter can be attributed to that one factor. Hence the experiment must have two groups to make a comparison.
The experiments can also be carried out by comparing its result with already existing groups. For example, if we are studying the effect of hair loss due to cancer, we can compare the result of this experiment with the effect of hair loss in people who do not have cancer.
Dependent Variable
The dependent variable is a variable whose value is being measured or tested in an experiment. It is the type of variable in an experiment whose value depends upon the value of the independent variable. It cannot be changed by the experimenter directly. Any changes in the dependent variables are attributed to the change in the independent variable.
In a cause and effect experiment, the dependent variable represents the effect of the experiment. Also, it is the output of any research. We can identify the dependent variable as:
- The variable that changes according to the changes in the independent variable.
- The variables whose values are being tested or experimented with.
- The variables whose values are controlled by other variables.
A dependent variable should have stability. That is if the research is carried out several times with the same conditions and inputs, the result should not change drastically. It is also possible to have multiple dependent variables that depend upon a single independent variable.
A dependent variable is a variable that is affected by the changes in the independent variable and it does not cause any change in other factors. It is the variables that are being affected and not the variables that cause any effect on other variables.
In the graphical representation of the relationship, the dependent variable is plotted on the Y-axis. This will clearly depict how the dependent variables are changed when the independent variable is manipulated.
Example
If the same experiment we discussed initially where the relationship of plants and watering rate, the growth of plants is the dependent variable. It depends on the watering rate and changes according to the change in the amount of water fed to it. We can also say that the growth of plants is the output that we observe from the experiment. This cannot be estimated beforehand.
Independent and Dependent Variable in Psychology
In psychological research, the independent and dependent variables are used to understand the effect of the psychological factors affecting the people.
The independent variables will be usually psychological in nature and will be something that affects the working of the mind of the people. The dependent variables will be the effect of the psychological changes on people which we used to compare and study the working of the human mind.
It is essential but often times also difficult to operationally define both independent and dependent variables before conducting any psychological experiments. For example, in a study where we study the effect of sleep deprivation on the concentration level of the students, we need to determine what we mean by sleep deprivation and concentration level very clearly. Without the operational definition, our problem statement is vague and we cannot come to an accurate conclusion. We need to know exactly what we are researching and what factors come into play during the experiment. For this, we need to specifically explain the experiment and its aim.
We could say that sleep deprivation refers to the sleeping hours of students which is less than 5 hours and the concentration level is the amount of time taken by the students who are 15 years old to learn a math lesson. Now, we made sure that we absolutely specified the terms in the experiment. This will make it easy for researchers to compare the result of different experiments of the same behavior which would be otherwise difficult, if not impossible.
The independent variable in this example will be the sleep hours of the students and the dependent variable will be the time taken to study the given math lesson. We could come up with a hypothesis statement that the students who slept well and had enough rest would have a higher concentration level and therefore would take less time to learn the lesson. Then we can check this statement by comparing the observations acquired from the experiment.
Independent and Dependent Variable in Biology
Independent and dependent variables also have application in biological and pharmaceutical experiments. The doctors use the knowledge they have that is inferred from various experiments conducted on the human body to prescribe medicines and cure diseases. Biological researches are carried out on biological organisms and cells for scientific and medical benefit. The experiments will be generally to determine a cause and effect relationship.
Suppose, consider that a study is conducted to determine the degradation of a virus in a given human body temperature. Now the independent variable will be the human body temperature taken in degrees Celsius and the dependent variable will be the time taken by the specified virus to degrade completely.
The pharmaceutical industry also conducts experiments to determine the best drugs to cure disease for animals, plants, and humans. An example can be the effect of a given drug on curing fever of people of different age groups. The independent variable will be the age of the people and the dependent variable will be the time taken by the drug to cure fever.
Independent and Dependent Variable in Maths
Independent and dependent variables in mathematical operations can be straightforwardly represented by an equation. All of the above examples include mathematical calculations and tools. Hence the equation is the best way to represent the variables. In mathematical calculations, variables are represented by alphabets.
Let us take an equation
y = x +4
Here we can say that the value of y changes as the value of x changes. Say that x values are free to change and the experiment is to find the y values in accordance with the change in the x values. Therefore, x can be taken as the independent variable and y can be taken as the dependent variable.
All the experiments are conducted to find a relation between these two variables. Hence the result of all experiments can be represented in equations and it can also be plotted on graphs. Even if at the end of the experiment we arrive at a conclusion that there is no relationship between the independent and the dependent variable, the result can be express in equations. In such cases, the equation would not contain either the independent or the dependent variable. The formation of equations and representation in graphs makes it easy and effective to compare the results of experiments with each other.
Independent and Dependent Variable in Science & Research
In scientific research, experiments are conducted to prove the given statement scientifically and apply the results to various fields of relevance.
The growth of plants and their relation with the watering system we discussed a few times previously is an example of scientific research.
Or to take another example, if we want to know the change in the voltage drop in two identical resistors due to the change in its position in the circuits, we first connect the resistors in parallel and then in series. Then we calculate the total voltage drop in the circuit on these resistors. Now, the independent variable will be the position of resistors and the dependent variable will be the amount of voltage drop on them.
All the experiments conducted to establish a relation between variables that are not previously proved will come under research study.
In research studies, a hypothetical statement is assumed and the efficacy of the same is measured via experiments.
All the examples we discuss so far were the results of research studies conducted by various scientists in different fields. The independent and dependent variables are identified, stated operationally, and are operated and manipulated to establish a relation between them.
Independent Vs Dependent Variable
Correctly identifying the independent and dependent variables is crucial for any experiment and it directly affects the credibility of the result. Sometimes, we find difficulty in identifying and labeling these variables. The difference between them is profound and we must understand and process it to identify one from another.
The major differences can be tabulated as follows:
| Independent Variable | Dependent Variable |
| A variable that is changed by the experimenter and is independent on its own. | A variable that is being tested and measured by the experimenter and is highly susceptible to change when the independent variable is manipulated. |
| It can be the input of the experiment. | It can be the output of the experiment |
| Represents the cause of a cause and effect relationship. | Represents the effect in a cause and effect relationship. |
| Usually plotted on the horizontal x-axis. | Usually plotted on the vertical y-axis. |
Control Variable
Control variables are another type of variables present in research apart from the independent and dependent variables. It is any variable that is controlled and held constant in an experiment because altering the control variable can have an influence on the outcome. Let us understand with an example
In the study of the plant growth and its relation to the watering system, there is another factor that may affect plant growth such as fertilizer usage. If the plants under study are fertilized in different quantities, this may also affect the growth of the plant.
In this scenario, we cannot establish that the amount of watering is not the only factor on which the plant growth depends upon. But the research is conducted to know the effect on the plant growth due to the amount of watering alone. Hence the quantity of fertilizer used for each plant should be held constant. That is, all the plants should be fertilized equally without any change in its quantity. This will eliminate the effect it has on plant growth. Therefore, the quantity of fertilizer is the control variable in our experiment.
Control variables should be controlled for accurate results. Otherwise, it gives us wrong conclusions and inferences. The control variables make the experiments easy to repeat and also increase the confidence in the results obtained.
Confounding Variables
The confounding variables are variables present in the experiments that are unaccounted for and influence the result of the experiment together with other factors. In our example of plant growth, say that we took different types of plants ranging from flowers to vegetables and conducted the test.
Now, we found out that the rose plant which is provided with 250 ml of water every day has a higher growth rate. But we couldn’t conclude that the result we obtained is solely based on the watering rate. The type of plant might also influence the growth rate. Even if the fertilizers are given in a specified quantity, we cannot absolutely state that our independent variable is solely responsible for the effect that is seen. We wouldn’t know the effect is due to the type of the plant or not. Hence the confounding variable here is the type of the plant. If these confounding variables are ignored or not accounted for, they suggest different relationships that are nonexistent and the results will be influenced negatively to a degree based on the gravity of the role confounding variable plays in the experiment.
History of Independent and Dependent Variables
The ancient Greeks had the concept of independent and dependent variables way back in 150 AD. The great scientist Ptolemy tabulated his finds on the relationship between the values of chords and angles in Almagest, his work on astronomy and mathematics, and the relationship between the incident and refracted angles in optics using these concepts. In AD 250, the Greek mathematician Diophantus had an algebraic symbol for the variables similar to the modern x.
The scientist Leibniz used the Latin word for the variable in 1692 but his concept of variables was not in the modern sense of the word. In 1698, Bernoulli’s concept of variables was the function of an analytic dependence. Newton also used these concepts to formulate his relationships of physical quantities. The term “ variable quantities” made its way into Harris’s Lexicon Technicum, the universal dictionary of arts and science 1710. “Variable Quantities, in Fluxions, are such as are supposed to be continually increasing or decreasing; and so do by the motion of their said Increase or Decrease Generate Lines, Areas or Solidities”
The English word “variable” and independent and dependent variables” was formed at the beginning of the 19th century. The Memoirs of the Analytical Society in 1813 and the English translation of Lacroix’s Differential and Integral Calculus in 1816 had the reference of independent and dependent variables.
The second edition of Elements of the Differential Calculus by John Radford Young in 1836 contained the reference of the dependent variable. Also, the statistician R. A. Fisher used these terms in his presentation of regression analysis in his work Statistical Methods for Research Workers in 1925.