Confounding Variable Definition
A confounding variable is an external third factor or variable that affects the outcome of a research study, influencing both the dependent and independent variables involved in the research. This will affect the result of the experiment in such a way that it suggests a non-existent connection between the research variables that gives an altogether invalid outcome.
What is a confounding variable?
In simple terms, a confounding variable is an extra variable that is not accounted for in a research study which influences the outcome of the experiment. This is a factor that researchers are unable to remove or control. Confounding variable is also called confounders or confounding factors.
In a research study, there will be an independent and a dependent variable in which the latter varies with respect to the former. For example, if research is carried out to check whether childhood obesity is caused by the lack of sufficient nutrition, then childhood obesity is the dependent variable and malnutrition is the independent variable. The confounding variable is another independent variable that is not considered in the research but all the same affects the dependent variable and hence manipulates the result.
If in the above research, one can say that the lack of exercise also accounts for childhood obesity. This leads to the conclusion that malnutrition is not the only cause of obesity. Also, if we experiment with children in different age groups, age can also be a factor. Hence age and lack of exercise can be identified as confounders here as it affects the dependent variable directly. This can lead to bias.
If confounders are not accounted for or reduced, it will lead to a poor research study and produces an invalid result with no actual relationship with the research variables.
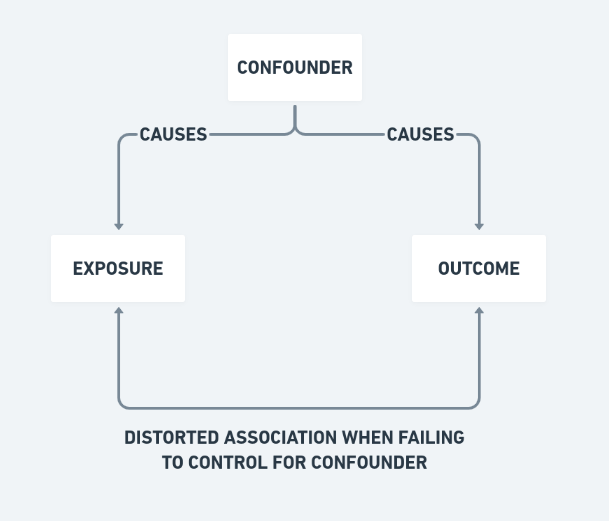
Confounding Bias
Confounding is also a form of bias. Bias in statistics is the tendency to underestimate or overestimate a parameter. Having confounding variables in the experiment results in confounding bias which is a result of the distortion in the degree of association between the exposure and an outcome in research. That is it shows or masks a true association when none exist. Confounding suggests that exposure is likely to occur and it modifies the outcome independently, suggesting an association between the exposure and the outcome.
Confounding bias has direction depending upon whether its effect is overestimation or underestimation.
- Positive confounding: this happens when the effect is overestimated. The observed association is biased away from the null.
- Negative confounding: This happens when the effect is underestimated, The observed association is biased towards the null.
How to Reduce Confounding Bias
There are several methods by which we can reduce the impact of the confounding variable. Each method has certain advantages and disadvantages. We can choose any method for accounting the confounders according to the necessity.
- Restriction
In this method, the research data is restricted by introducing control variables to limit the confounding variables.
For instance, if we have to know whether childhood obesity is caused due to malnutrition, we restrict the value of the possible confounders that can arise in the research such as age and exercise period. Hence we could restrict the age of the children to 10 years old who exercises for an hour a day. Thus, eliminating the possibility of bias.
Advantages:
- Easy to implement.
Disadvantages:
- This may restrict the sample size.
- It may possible not to consider other confounders.
- Matching
The matching method distributes the confounders across the researched data evenly. A comparison group is selected for the treatment group provided that each element in the comparison group have a corresponding counterpart in the treatment group with the same values of potential confounders but different independent variables. Thus, observations are taken in pairs.
In our case, a child is analyzed whether they suffer from obesity due to malnutrition by comparing them with another child who has had enough nutritious food. Both of the children should be of the same age and have the same exercise habits. This way, all the children can be observe=ved and we can accurately come to a conclusion from our research.
Advantages:
- No restriction on the sample size.
Disadvantages:
- Difficult to implement as pairs of each element need to be found out.
- Other variables we cannot match on might lead to confounding bias.
- Statistical Control
Confounders can also be included in the regression models as variables if the data is already collected. Any impact of the confounders will be shown in the results and we can accurately identify the impact of the independent variable.
We can include the age and exercise habits of the children in the regression model after collecting the details of the children who suffer from obesity due to malnutrition. This way, we can easily observe the impact of malnutrition.
Advantages:
- Easy to implement.
- This can be implemented after the data collection.
Disadvantages:
- Directly observed control variables can only be accounted for.
- Randomization
In this method, we randomize the value of the independent variable. This prevents any cases of bias in research work. With a large sample size, randomization makes sure that all the confounders including the factors that we cannot observe directly are accounted for and will have the same value in each group. Every member of the sample has an equal chase of sampling in this method.
As it accounts for nearly every confounders, this method is regarded as the best method for reducing the confounding bias.
In our example, for implementing randomization, we collect the details of every child who suffers from obesity. And then we select a group of children randomly and provide them with nutritious food. Here the treatment group is the children we selected and the control group is the rest. Even if we do not consider any other confounders that are not directly observed, this method ensures that they are all accounted for.
Advantages:
- Possible to account for all confounders.
- The best method to reduce the impact of confounders.
Disadvantages:
- Difficult to implement.
- It should be implemented before the collection of data.
- The treatment group should only receive the treatment in the research.
Confounding Variable Examples
Let us go through some more examples of confounding variable/bias to help us get a better grasp of the concept.
Example 1:
Research is carried out to know the relationship between money and the people going on a vacation. Here, the independent variable is money, and the dependent variable is going on vacation. It is seen that a positive correlation exists between the dependent and independent variables. That is, if people have more money, they go for a vacation.
However, there is a confounder in this research, The confounder variable can be the weather. When it is winter, people have less work and therefore no money to go on vacation. And in summer, people have more work and have enough money to go on vacation. Hence weather is a confounder in this research.
Example 2:
A study was conducted to know the relation between the force applied for rowing a boat in a river and the speed with which the boat travels. We can say that more the force applied, the boat travels faster. But if we are rowing upstream, the result might be different from the result observed while rowing downstream and directly related to the speed of the stream. We need to apply more force when we are rowing upstream and less while rowing downstream. That is, the confounding variables here are the direction in which the boat travels and speed of the stream.
Example 3:
We have to know the relation between the infant mortality rate and early childbirth. One could conclude that premature-childbirth leads to an increase in infant mortality. But we have to take the health conditions of the mother into consideration that might lead to infant mortality. Hence, the health of the mother is the confounding variable here.
Confounding Variables in Statistics
Confounding variables often arise in the statistical calculation. Whenever an experiment or research is carried out, we have to define all the variables that might come into play to produce an effect. When we conduct a hypothesis test, confounding variables may manipulate the effect of the test unless they are identified and accounted for. As we are expected to perform a calculation with limited data frequently, there are chances to overlook or ignore these confounders. A statistician or a researcher must be able to identify the possible confounders that might influence the result of the calculation or experiment. In the business sector, this is essential in the study of market analysis and finance. In the market analysis, the strategists must study each and every factor that affects the profit of the business or firm to grow their business. This will help the firm to have a strong strategy for their future ventures.
Suppose, say that we have to find out the relation between the increase in consumers for the life insurance policy and the income of the family. After collecting data and processing it, we arrive at a conclusion that if the income increases, people are more inclined to take a life insurance policy. At the same time, there are people who suffer from life-threatening diseases who also take the policy regardless of their income. Hence the health of people is the confounder in this case.
Confounding Variables in Psychology
Confounders also appear in psychological analysis. Here, the confounder variables will be psychological in nature. In almost every psychoanalytic research, the topic under study will be the mind of the people and the factors which affect it. The characteristics of the people, their mindset, attitude, abilities, environment, upbringing, trauma, family, emotions etc. If research is conducted to know how a person’s mind works, it will be very difficult to point out exactly what causes the person to behave in a particular way. There will be uncertainty regarding the factors that affect the person’s mind to function the way it functions. Also, each person is different from another and this adds to the difficulty. Hence confounders are mostly unpredictable in psychological analysis. It might be difficult to account for every factor in the analysis. Hence the confounders arise.
Suppose, If a study is conducted to know whether the concentration level of people increases when they consume more caffeine. It is seen that if we consume more caffeine, our concentration level increase. So the dependent variable changes with respect to the independent variable.
Now, say that we got a good night of sleep and went for a class without taking any caffeine. We may get as much concentration as we had from a cup of coffee. Hence sleep is a confounder in this case, which is an independent variable on its own that has nothing to do with the caffeine consumption, which was our actual independent variable.
How do Confounding Variables Affect Independent and Dependent Variables?
As we have already seen, in cause and effect research, there always exists an independent and dependent variable. The effect can be called a dependent variable that depends upon the cause which represents the independent variable. An independent variable can be defined as the lead factor that triggers a change in the dependent variable.
The correlation between these two variables in a research environment can be affected by the confounding variable which comes from outside the research environment and is unaccounted for. They can suggest a positive correlation between the independent and dependent variables when there is none. This false correlational relationship might arise a lot of confusion for the researchers. Confounders can also manipulate the outcome of the research by changing the dependent variable drastically.
A confounding variable may result in:
- Increased variance
This refers to the increase in the number of possible independent variables in an experiment. A dependent variable may get influenced by multiple independent variables in this case.
- Confounding bias
As already discussed this arises an underestimation or overestimation of the results of an experiment. Bias can be positive or negative.
- Invalid research outcomes
As confounders are a third factor that is unaccounted for, this will lead to inaccurate results in the research. This happens when they influence the dependent variable and trigger changes in them.
A confounder can remove the independent variable altogether from the research and form the correlational relation. This may happen when the dependent variable changes with respect to the confounder, and a correlation happens between the dependent variable and the confounder. That is, an independent variable seems to get removed from the relationship if the changes independent variables and the results of the research are triggered by the confounder rather than by the independent variable. Hence controlling the research environment and accounting for the confounding variable is essential in a research process to get accurate results and outcomes.