What is Z Score?
Simply put, a z-score (also called as standard score) gives you an idea of how far from the mean a data point is. More technically it’s a measure of how many standard deviations below or above the population mean a raw score is.
Z score is the position of a single data with respect to its mean value which is defined in terms of standard deviation. It is a raw value’s relationship to a set of values. Z score of a value defines how far or close the position of a raw value is from the mean value of the set of data. It is represented in terms of standard deviation. In simpler terms, the Z score is the value of the deviation of a single data from its group mean value represented in terms of standard deviation
A set of data only makes sense if any relevant information could be extracted from it. For example, let’s say the test scores of the students in a class are published. This is a set of data. Erica scores 62 marks out of 100 and is curious if she has scored better than the average. She is curious if majority of the students have scored higher or lower than her. She is curious what percentage of the students have scored lower than her and what percentage of students have scored more than her. She is curious what the average marks is for the class room.
This is where the Z-statistics and Z-Score come to play. These questions can be answered by organizing, analyzing, and interpreting the data set. The answers to Erica’s question depends on other students’ score and Erica’s score in relation to them. Z-Score not only helps us determine both, Erica’s score in relation to other students as well as the exact position of her score in the data set. Z score is a fundamental statistical calculation that is used for determining the relationship between the specified data and its dataset values.
Z Score Formula
The formula for Z score is given as:
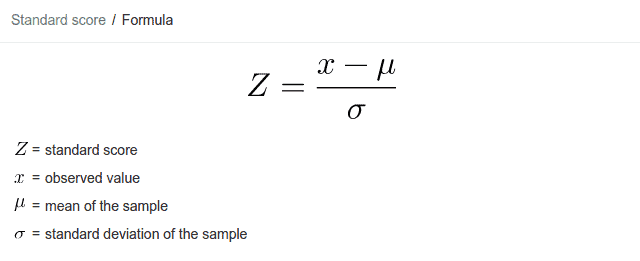
Mean
The mean value of a given set of data is defined as the average value of the scores of that set of data. It is calculated by adding the observations and dividing by the total number of observations. Mean is the central value of a set of values.
Standard Deviation
Before looking at standard deviation, let us know what variance is. Variance is the measurement of how widely spread the numbers are in a dataset. It measures how far each number is from the mean and from each other. Standard deviation is the square root of the variance. Hence it is the measure of the spread of the dataset with reference to the mean. It is represented by the formula
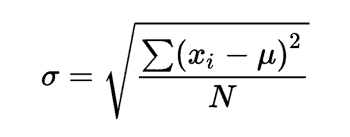
A dataset only has one mean value. But each of the elements in any dataset has a specific standard deviation.
How to Calculate the Z Score
Let us understand how the Z-Score is calculated with the help of an example.
Let’s say we pick a random student named Jacob with an height of 180cm (x) and the mean (μ) height for the students in the college is 160cm and the standard deviation (σ) is 15.
Therefore, substituting the above values in our Z-Score formula, we get:
z = (x – μ) / σ
z = (180 – 160) / 15
z = 20 / 15
z = 1.33
Hence, we find out that our Z-Score is 1.33. Meaning, the random student’s height of 180cm is 1.33 standard deviations above the mean
Positive & Negative Z Scores
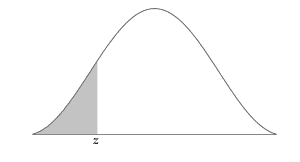
Z score points the location of an element in a standard normal distribution. It could be below or above the mean value. By reference to the SND, the Z score could be left or right of the mean. A raw element’s Z score clearly shows whether the element is below or above the average by the sign of it. Hence Z score is a signed value. In other words, the Z score could be positive or negative.
- If the z score of an element is 0, it is on the mean. A Z-Score equal to 0 means that the element is zero standard deviation away from the mean.
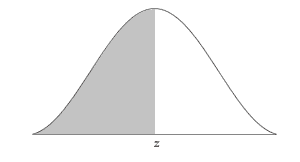
- If the z score is positive, the element will be higher than the mean value. An element with a positive Z score lies on the right of the mean in SND.
- If the z-score is negative, the element is lower than the mean value. An element with a negative Z score lies on the left of the mean in SND.
Z Score Vs Standard Deviation
There may arise a doubt regarding the difference between standard deviation and Z score since both of these parameters relate an element to the dataset mean value. But the standard deviation and Z score of a specific element are not the same. Understanding the difference between these two terms is essential.
Standard deviation indicates how the values are spread around the average. It gives us a range in which the values are dispersed. It gives the amount of deviation of an element from the average but does not say the element is below or above the average.
While the Z score gives the position of each element with respect to the average. Z score determines how many standard deviations away an element is from the mean value and whether the value is below or above the mean. Z score can be observed as a location in a distribution. If we know the mean and standard deviation of a data set, the Z score can be calculated.
Why the Z-Score is also known as the ‘Standard Score‘?
The Z-Score is also known as the standard score because it standardizes the distribution and allows the comparison of scores between different kinds of variables and different normal distribution. This is an important characteristic of the Z score which is widely applicable for real-life problems.
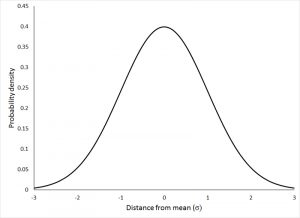
The normal distribution is a graph that shows the spread of elements around the mean value. The graph is symmetric about the mean value. It’s a probability distribution curve that clearly shows elements that are close to the mean value are more in occurrence than that are far from it. Hence it is shaped like a bell curve.
The standard normal distribution (SND) is a normal distribution that has mean value as zero and standard deviation as one and has the same shape as the normal distribution curve.
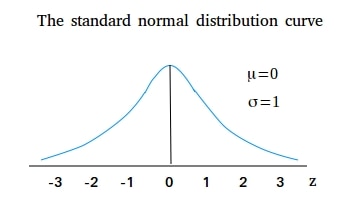
The Z-Score helps us standardize the scores and helps us to relate one normal distribution to another.
Z-Score and The Empirical Rule
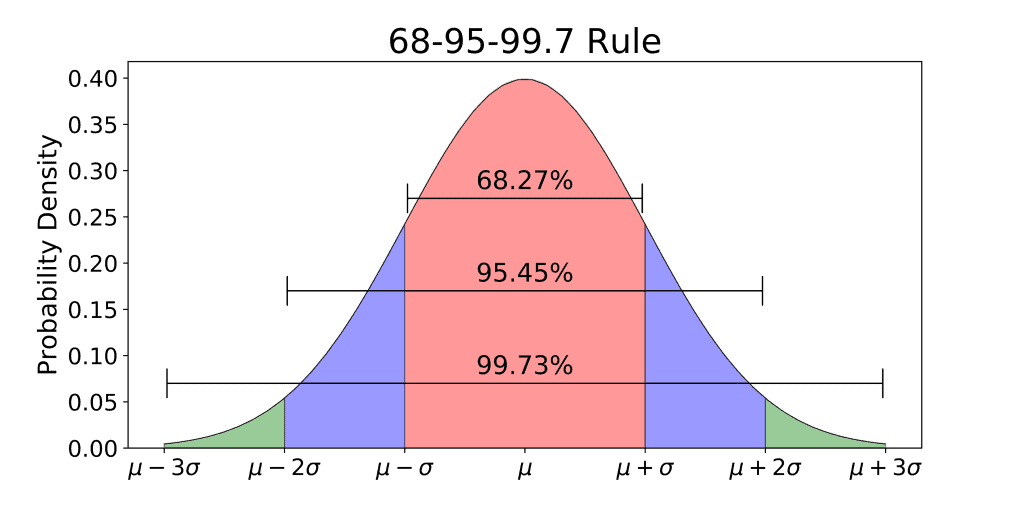
The percentage shown in the figure indicates the probability of finding a raw element in the graph, as shown, the probability of finding a value from:
- -1 to +1 z scores is 68%.
- -2 to +2 z Scores is 95%.
- -3 to +3 is 99.97%.
This is known as the Empirical rule of the standard normal distribution or the 68-95-99.7 Rule. Since the Z-Score is basically the number of standard deviations about the mean, the Empirical Rule when used along with Z-Score or Z-Statistics, helps us better predict the probability of occurrence of values and the range it lies in. The Empirical Rule also shows that the probability of finding a raw value near the mean value in the standard normal distribution is very high for standard normal curves, hence the bell shape.
Mapping Z scores on the Z table.
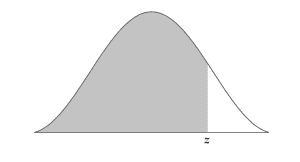
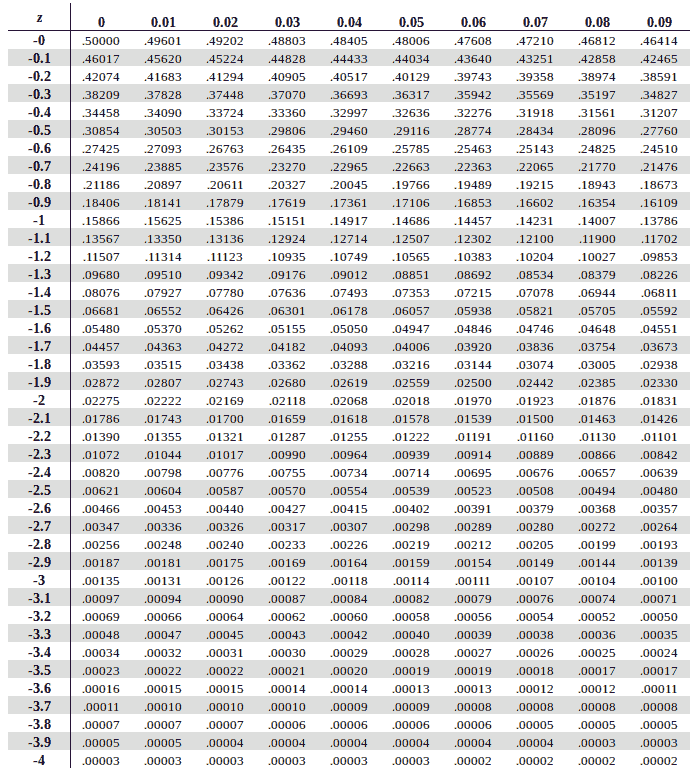
Z score is also used to calculate the area associated with it and to find areas under the curve. Here we make use of the Z-Table or the standard normal table.
By referring to this table, we can find the exact area to the left or right of a Z score in a standard normal distribution. By calculating the area, we are in fact calculating the probability of finding an element in the specified area.
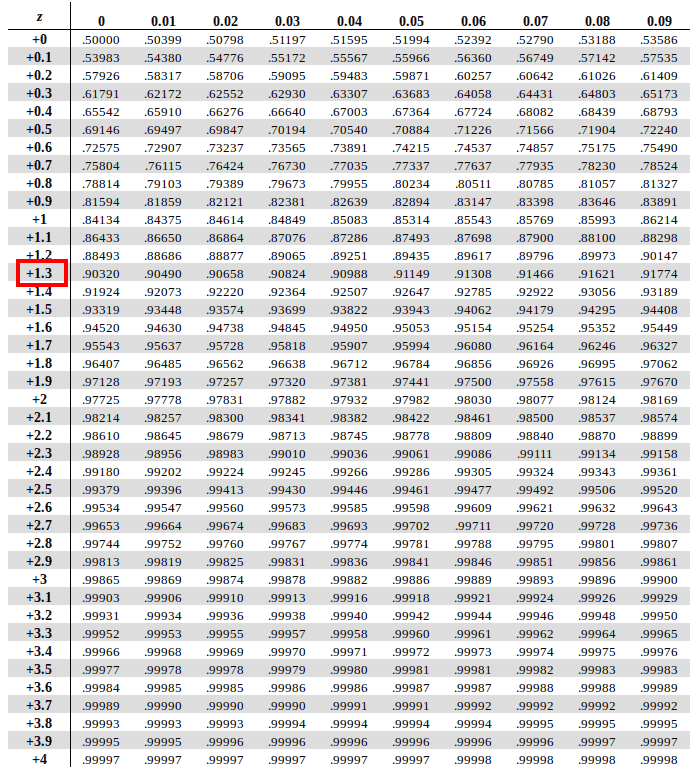
We will use a positive Z-Score table or a negative Z-Score table depending on whether our Z-Score is positive or negative, respectively.
Example: Let us learn how to map a Z-Score on a Z-Table using an example. Let us use the same example we used previously where we calculate the Z-Score for Jacob’s height which comes to 1.33
Hence, Z = 1.33
Since our Z-Score is positive, we will use the positive Z-Score table.
First, we will traverse along the Y-Axis and map the first two digits of our Z-Score. (+1.3 in our case)
Next, we will traverse along the X-Axis and map the second decimal position of Z-Score (+0.03 in our case)
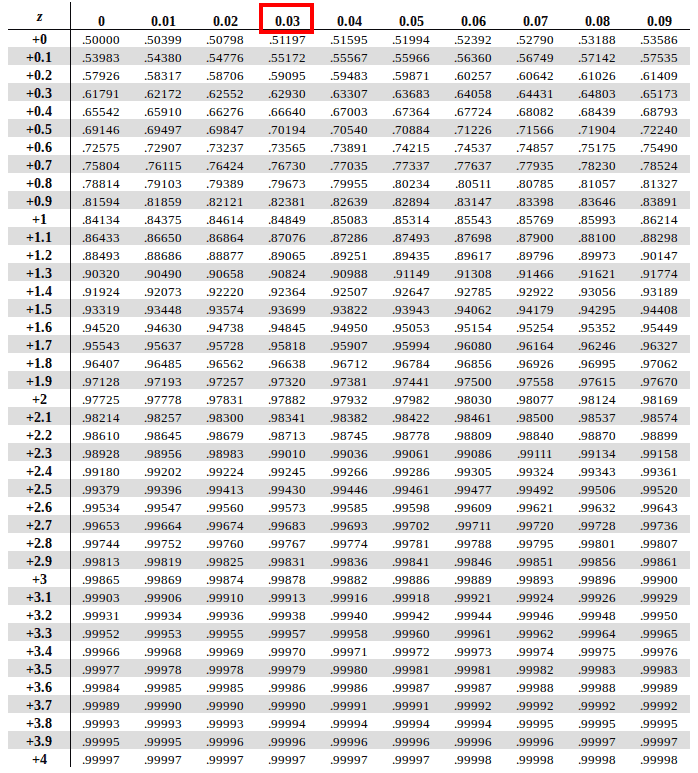
The intersection of these two will present us with our answer
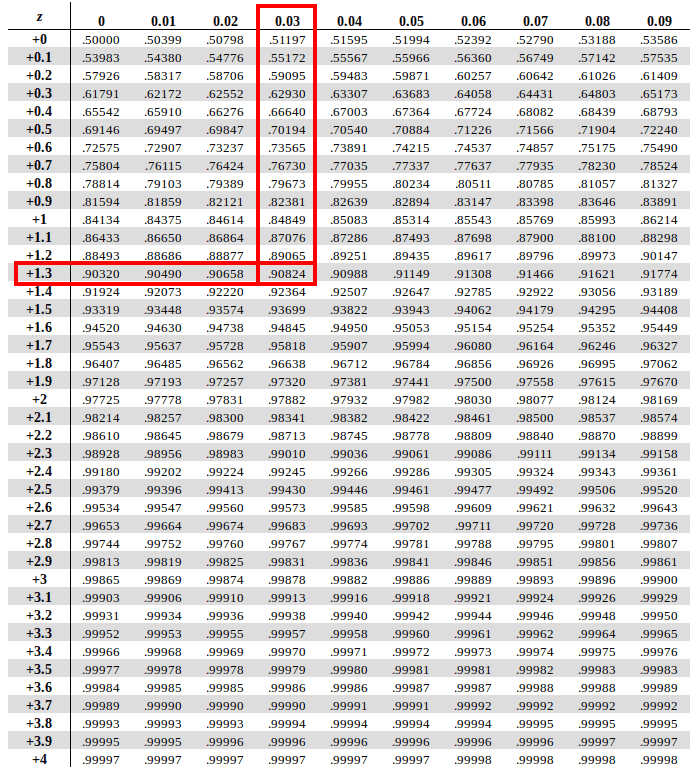
The intersection of the two returns us with an value of 0.90824
To get this as an percentage we multiply the same with 100. (0.90824 x 100 = 90.824). Hence, we find out that Jacob is taller than 90.824% of the students in his college