Variance Definition
In probability and statistics, variance is defined as the expected value of the squared deviation of a random variable from its mean value. It can also be described as the measurement of the spread between each number in a data set.
Variance indicates variability. A data set will have a mean value and variance indicates how far the elements are spread out around this mean value. If the elements are largely apart from each other, the variance will be high and if closer, the variance will be low.
If the elements of dataset A are 2, 3, 4, 5 and 3 and the elements of dataset B are 2, 7, 10, 3 and 17, the data set B will have a higher variance as the elements in data set B are more spread out and more apart from each other.
The lowest value for variance will be zero. A variance value of zero will be expected if the elements are identical. To calculate the variance of a given data set, it is necessary to know the mean value of the data set.
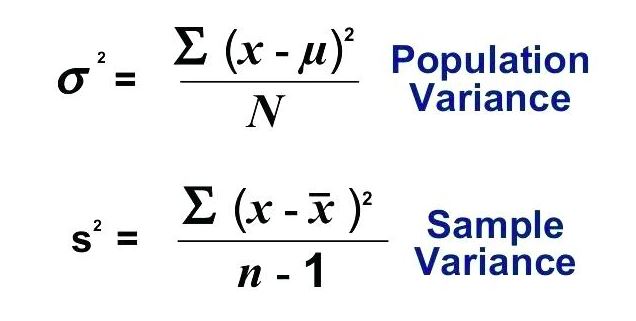
Variance Formula
There are two types of variances. Population variance and sample variance. The formula for each is given below and what exactly each of the two are and what the differences between the two are will be studied later in the article
Variance of a Random Variable
Variance is also used in binomial distribution where the probability of success and failure is determined. In binomial distribution. Variance is used for finding the variability of a random variable X.
The equation for the variability for the random variable X, Var(x) is given by:
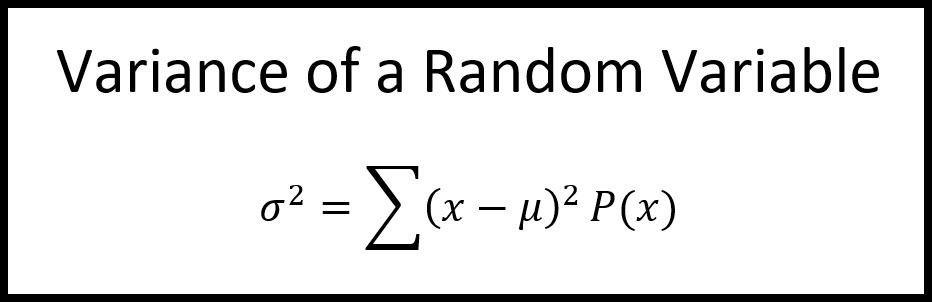
Where P(x) is the probability mass function
Variance Example
Let us illustrate the calculation of both population variance and sample with an example first and understand how the formulas are used and then take a look at the differences between population and sample variance
Question: It is given that the ages of the children in a housing colony are: 3, 8, 6, 10, 12, 9, 11, 10, 12, 7. Calculate the population and sample variance for this dataset.
Solution:
Let us calculate the variance of the ages of the children step by step:
Step 1: Calculating the mean value
The number of children = N = 10
Mean = [ 3+8+6+10+12+9+11+10+12+7] / 10
Mean = 8.8 years
Step 2: Calculate the deviation and squaring it
| X | X – Mean | [ X – Mean ]2 |
| 3 | -5.8 | 33.64 |
| 8 | -0.8 | 0.64 |
| 6 | -2.8 | 7.84 |
| 10 | 1.2 | 1.44 |
| 12 | 3.2 | 10.24 |
| 9 | 0.2 | 0.04 |
| 11 | 2.2 | 4.84 |
| 10 | 1.2 | 1.44 |
| 12 | 3.2 | 10.24 |
| 7 | -1.8 | 3.24 |
| Total | 0 | 73.6 |
Step 3: Calculating the population variance
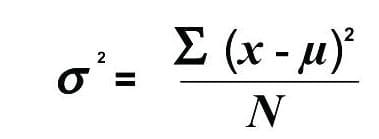
Substituting the values in the above formula, we get
σ2 = 73.6 / 10 = 7.36 years
Hence, the population variance = σ2 = 7.36 years
Step 4: Calculating the sample variance
Now let us say that the 10 children whose age are provided are from 10 families who are the oldest occupants of the colony. That is there are more families with children in the area who are recent occupants.
Now the data we are provided with is sample data i.e let us assume that our dataset above is a sub-set of a much larger dataset. In such a case, we are calculating the sample variance. Hence we have to use the sample variance equation to find the variance.
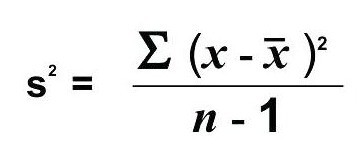
S2 = 73.6 / (10-1) = 8.17 years
Hence, the sample variance = S2 = 8.17 years
Squaring of Differences
The squaring of each difference is done to prevent the numbers from canceling out each other. This is one of the significant advantages of the variance. It measures the variability of each element from the mean value without considering its direction. However, the squaring will lead to the unit of the variance to be different from the original unit of the data set. Hence the unit of the original data will get squared when the variance is calculated.
In the above example, it is observed clearly that the squaring of the deviations are necessary to get an accurate variance value. Sometimes the value of elements will be smaller than the mean. Hence the difference will give a negative number. When we take the average of this difference as such, the negative and positive numbers might cancel out each other. Squaring the difference will eliminate this problem.
If the squaring of differences is not done in the above example, the sum of the deviation will be equal to zero and thereby we get a result as the variance is equal to zero. This cannot be true as the ages of the children are not identical and there exists a degree of variation. Hence in order to avoid the direction of the deviation of the elements from the mean, the deviation value is squared, and then the variance is calculated.
Let us understand the same using an example:
Example: Suppose the differences are given for data set A that has 4 elements as -1, 2, -4, 9
If we take the absolute value and divide by 4, we get:
[ |-1| + |2| + |-4| + |9| ] / 4 = 4
Now if another data set B has the differences as -4, 4,4,4
We get [ |-4| + |4| + |4| +|4| ] / 4 = 4
Now, both have the same variability even though data set A has a greater spread than dataset B.
By squaring each difference, we ensure that this problem will not arise and when substituted in the formulas for variance, will ensure that dataset A reports greater variance than dataset B.
Population Variance Vs Sample Variance
In the above example, we saw the terms population variance and sample variance. Let us understand each in detail.
If we are provided with the whole of the data in a dataset, then we calculate the population variance. The example we have taken in the previous section can be used to illustrate this. If the 10 children whose age we are provided with are the only number of children in the particular housing colony, then we are calculating the population variance. On the other hand, let us say that there are a total of 20 children in the housing colony and the ages of 10 children that are listed are the children who were selected under a specific criteria. In this case, we are asked to calculate the variance of the ages of the total children by providing only a portion of the data. This portion of the data can be called a sample data of the whole population. This is where the sample variance is calculated.
While calculating the sample variation, we are trying to calculate the population variance with only a sample of the data. Therefore the chances of error occurrence might be high as we are not provided with the entire data set. To avoid this, a change in the equation of the population variance is made known as Bessel’s correction.
The value of the variance calculated from the sample data might be slightly different from the actual variance calculated by taking the whole population. This difference will be higher especially if the number of elements in the sample is low or the corresponding population size is high. So we need to correct the error to get the actual variance.
As we are working with the sample mean (x̄), the elements will be much closer to the sample mean. Hence the squared differences will be smaller. This will lead to a smaller value in the numerator of the sample variance equation compared to the population variance equation. If we divide this squared difference with the sample size n, this will lead to a variance value that is smaller than the actual value.
But the population variance value should be accurate. For this, we subtract 1 from the sample size so as to get a smaller denominator in the sample equation and thereby producing a larger variance value from the equation. This correction of the sample size from n to n-1 is known as Bessel’s correction.
In the example, the sample variance is slightly higher than the population variance as we consider the ages of the 10 children as a sample from the total ages of 20 children. When the total data set of 20 elements is taken into consideration, the variance value will be obviously higher than the value we obtain when we take the 10 elements that are provided as the total population size.
In most of the real world scenarios, we calculate variance using sample data as the whole of the population data is rarely given or difficult to achieve.
Variance Vs Standard Deviation
Standard deviation can be defined as a statistic used to measure the dispersion of a given dataset in relation to it’s mean and can be calculated by taking the square root of the variance.
The equation for the population standard deviation and sample standard deviation is given as:
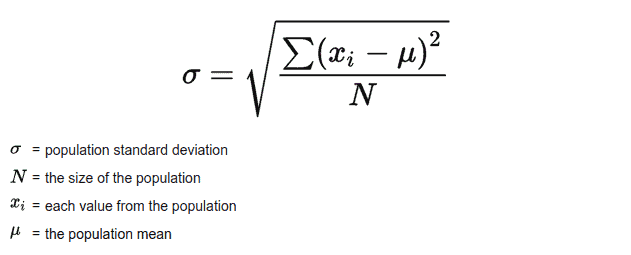
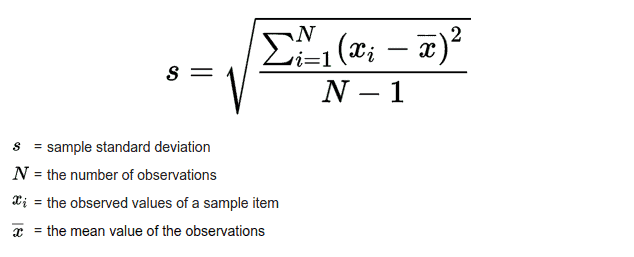
A standard deviation is always a positive number. The lowest value for a standard deviation is zero when the elements are identical. Both standard deviation and variance are two distinct parameters with few similarities.
Let us look at the similarities :
- Variance and standard deviation give the measure of the spread between the elements around the mean.
- The mean value should be determined to calculate both.
- Variance and standard deviation values are always positive. As variance is a squared value, it is always positive and the standard deviation is the positive root of the variance.
- Both variance and standard deviation will be equal to zero if the elements are identical.
- Both take the square of the differences of each element from the mean.
- Both variance and standard deviation do not consider the direction of the variability or deviation of the elements from the mean.
Nevertheless, these two parameters are distinct and different.
| Variance | Standard Deviation |
| The variance is the average of squared differences of each element from the mean. | The standard deviation is the square root of the average of the squared differences of each element from the mean. |
| The variance is represented by σ2 | The standard deviation is represented by σ |
| The variance indicates how far the elements are spread out in a dataset. | The standard deviation gives how much the observations differ from the mean. |
| The variance describes how far the elements are dispersed from the mean. | The standard deviation measures the amount of this dispersion of elements quantitatively. |
| The variance is a squared value. Hence the unit will not be the same as that of the dataset. The unit will also get squared. | The standard deviation has the same unit as the original data. There is no difference in units. |
| The variance value will be always higher than the standard deviation value. | The standard deviation is the positive square root of the variance. |
The standard deviation is introduced in statistics due to a disadvantage of the variance which is that the variance calculation give added weight to the elements that are far from the mean which makes it less accurate. The variance is calculated primarily to take the square root value of it which is the standard deviation.