Variance
Variance is defined as the average value of the squared differences from the mean. As the name indicates, it is a measure of variability from the mean. It shows how far a data set is spread out around the mean.
If the elements are largely apart from each other, a higher variance value is expected. On the other hand, if the elements are closer to the mean value and to each other, there is much less amount of variability and hence the variance will be lower.
Variance is represented by σ2
To calculate the variance of a given dataset, first, we have to find the mean value by adding all the elements and dividing the sum by the total number of elements. Once the mean value is determined, the variance can be calculated by the formula given below.
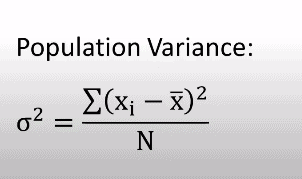
Where
- σ2 = Population variance
- x̅ = population mean
- Xi = individual values
- N = Size of Population
After finding the value of the mean x̅, it is subtracted from each element x and it is squared to get the squared difference. Once the squared differences of each element are added, it is divided by the total number of elements in the population. The result is the variance of the dataset.
Now. if we have to calculate the variance by taking a sample of the population, there is a change in the equation. For calculating the variance from a sample data the equation to be used is given below.
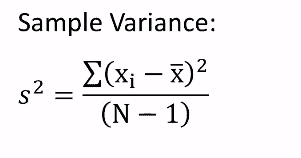
Where
- S2 = Sample variance
- x̅ = sample mean
- Xi = individual values
- N = Size of Population
As you can see 1 is subtracted from the sample size of n. This is done according to Bessel’s correction.
What is Bessel’s Correction?
When we are using sample data from the population, there will be errors while calculating the variance and standard deviation as we are only provided with a selection of elements and not the entire population. The value of the variance calculated from the sample data might be slightly different from the actual variance calculated by taking the whole population. This difference will be higher especially if the number of elements in the sample is low or the corresponding population size is high. So we need to correct the error to get the actual variance.
As we are working with the sample mean x̅, the elements will be much closer to the sample mean, and hence the squared differences will be smaller. This will lead to a smaller value in the numerator of the sample variance equation compared to the population variance equation. If we divide this squared difference with the sample size n, this will lead to a variance value that is smaller than the actual value.
But the variance value should be accurate. For this, we subtract 1 from the sample size so as to get a smaller denominator in the sample equation and thereby producing a larger variance value from the equation. This correction of the sample size from n to n-1 is known as Bessel’s correction.
All values of variance that are not zero will be positive. We get a variance value of zero if the elements are identical
Standard Deviation
Standard deviation can be defined as a statistic used to measure the dispersion of a given dataset in relation to it’s mean and is expressed as the square root of the variance. Meaning in simple words, the standard deviation shows how spread out the elements are in a data set.
It is also known as the root mean square deviation. It is a measure of the dispersion of the dataset. If the elements are more spread out, there will be a higher measure of deviation and hence the standard deviation will be high and vice versa if the elements are less spread out, there will be a lower measure of deviation.
The equation for the population and the sample standard deviation is given below:
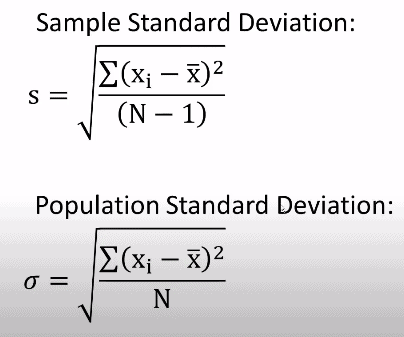
As it is seen from the equation, the standard deviation is simply the square root of the variance.
We have used Bessel’s correction in this equation too to adjust the effect of the deflated numerator in the sample standard deviation equation.
A standard deviation is always a positive number and it is always calculated in the same unit of the original data. The lowest value of the standard deviation is equal to zero when the elements are identical.
Variance and standard deviation play a key role in statistical data analysis that has applications in various fields including finance, business, trade, and polls.
Variance vs Standard Deviation
Both variance and the standard deviation is a measure of the spread of the elements in a data set from its mean value. For calculating both, we need to know the mean of the population. However, variance and the standard deviation are not exactly the same. In fact, there are stark differences between both parameters.
Let us look at each difference in detail
- The variance describes how far the elements are dispersed from the mean, whereas the standard deviation measures the amount of this dispersion of elements. In other words, the variance indicates the variability of the elements and standard deviation quantifies it.
- One of the most important differences between variance and the standard deviation is their units.
- The variance is a squared value. Hence the unit will not be the same as that of the dataset. The unit will also get squared. For instance, if the data set is in the unit kilometer, the variance has a unit of a square kilometer.
- On the other hand, the standard deviation has the same unit as the original data. There is no difference in units.
- Variance indicates how far the individual elements are spread out in a dataset and standard deviation indicates how much the observations differ from the mean value.
- The variance value will be always higher than the standard deviation value. Also, the variance will be the square of the standard deviation.
- The variance is the average of the squared differences of each element from the mean and standard deviation is the square root of the average of the squared differences from the mean.
- Variance is represented by σ2 and the standard deviation is represented by σ.
Why do we square the differences from the mean?
For both variance and standard deviation, we take the square of the difference of each element from the mean. This is to prevent the cancelling out of the numbers of different signs. Sometimes the value of elements will be smaller than the mean. Hence the difference will give a negative number. When we take the average of this difference as such, the negative and positive numbers might cancel out each other.
So why not take the absolute value instead of square? Let us illustrate this with an example:
Suppose the differences are given for data set 1 that has 4 elements as -1, 2, -4, 9
If we take the absolute value and divide by 4, we get:
[ |-1| + |2| + |-4| + |9| ] / 4 = 4
Now if another data set 2 has the differences as -4, 4,4,4
We get [ |-4| + |4| + |4| +|4| ] / 4 = 4
Now, both have the same variability even though data set 1 has a greater spread than dataset 2.
By squaring each difference, we ensure that this problem will not arise.
If we square each difference,
- The variance of data set 1 will be = 31
- The variance of dataset 2 will be = 16
Here, dataset 1 that has more spread has a greater variance than dataset 2.
Calculation of Variance and Standard Deviation With An Example
The list of the distance between the class and the home of each student is estimated in a class that has 10 students.
The distance in kilometers are listed as : 9,4,8,10,5,3,7,8,9,
N = 10
Mean distance = [ 9 + 4 + 8 + 10 + 5 + 3 + 7 + 8 + 9 + 7 ] / 10
Mean = x̅ = 70 / 10 = 7km
| X | X – Mean | [X – Mean] ^ 2 |
| 9 | 2 | 4 |
| 4 | -3 | 9 |
| 8 | 1 | 1 |
| 10 | 3 | 9 |
| 5 | -2 | 4 |
| 3 | -4 | 16 |
| 7 | 0 | 0 |
| 8 | 1 | 1 |
| 9 | 2 | 4 |
| 7 | 0 | 0 |
Variance = [ 4 + 9 + 1 + 9 + 4 + 16 + 0 + 1 + 4 + 0] / 10 = 4.89 square km
Standard deviation = [ 4.89 ] ^ (1/2) = 2.21 km