We always use pre-made Z Tables but have you ever wondered where the values in a Z Table come from and how a Z Score Table is created from scratch?
If you are an inquisitive mind and have been repeatedly dealing with normal distribution and z score statistics, it is but natural that at some point of time you must have asked yourself how the values in a Z Score Table are derived and what the math behind them is.
Disclaimer: Before we dive in, please keep in mind that deriving a Z-Table from scratch is very math heavy and intensive. One is not required to know how to derive a Z-Table to perform any elementary probability or statistics or even beyond it. Nor is one required to derive a Z-Table from scratch every time before one uses it. As long as you know how to read a simple Z-Table, you’re good to go. While knowing the derivations below is certainly helpful, they are not required to be learned or known by you. The explanation below is just to feed the curiosity and for research purposes.
If you’re looking to just use the Z Table without wanting to learn how to derive it, please head over to our main page or refer the two Z Tables provided below.
Probability Density Function
Before one learns how to create a Z Table from scratch and as to where the values come from, one needs to know what the probability density function (PDF) is.
Well, what is the probability density function? A probability density function (PDF) is a function in probability theory whose value in the sample space at any given point or sample, can be interpreted as providing a relative likelihood that the value of the random variable would equal that sample.
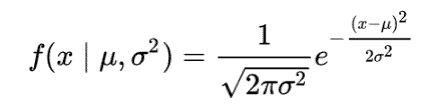
What this means in simple terms is that (because there are an infinite possible values) for a continuous variable the absolute likelihood to take on a particular value is 0. This let’s us use the probability density function to calculate how much a random variable drawn would equal a sample in comparison of samples. It let’s us calculate the range of values in which the probabilities of the same variable will fall, as opposed to taking on any one value. Hence, the probability distribution function for a normal distribution is expressed in a mathematical formula as:
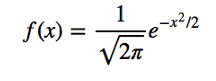
Which for a standard normal distribution with a mean (µ) of 0 and standard deviation (σ ) of 1 simplifies to
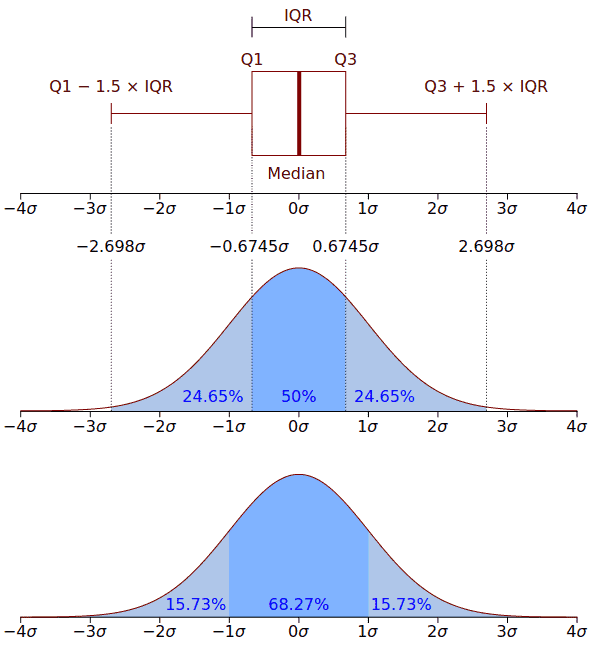
When the probability density function for a standard distribution is graphed, we get a graph that is eerily similar to a normal distribution curve as seen below
Cumulative Distribution Function
The probability density function only provides us with the probability density but not the probability of events within a given range. To find the probability of events within a given range we will need to integrate.
What is the Cumulative Distribution Function? In probability theory and statistics, the cumulative distribution function of a random variable X or a distribution function of X, evaluated at x is the probability that X will take a value less than or equal to x. Meaning, integrating the probability density function in a given distribution, the cumulative distribution function helps us map values to their percentile ranks.
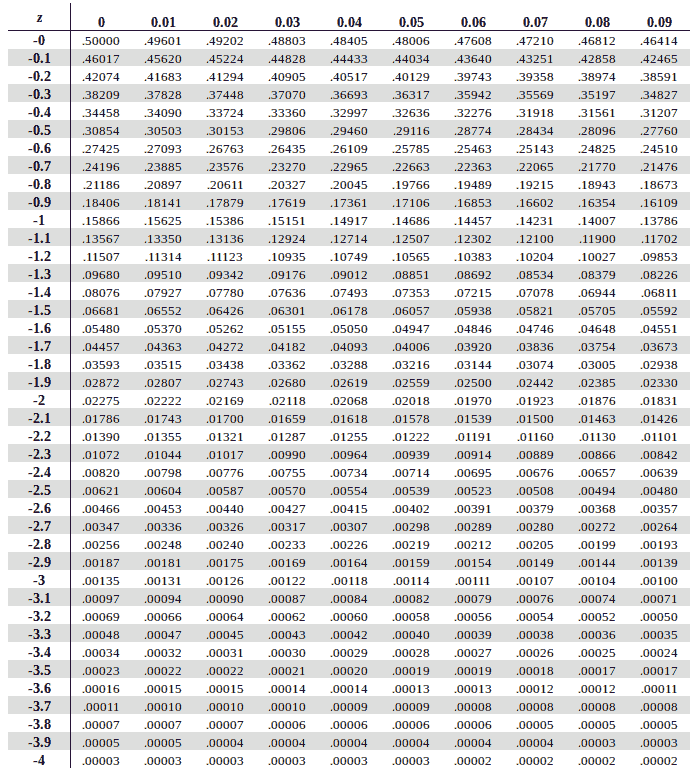
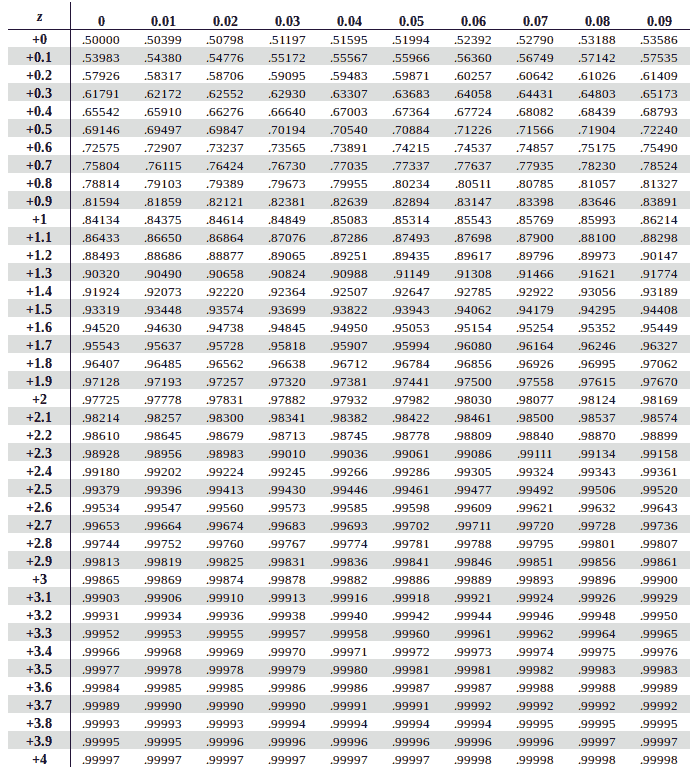
When we calculate the cumulative distribution function of a standard normal distribution (with standard deviation (σ) = 1 and mean (µ) = 0 ), we get the values in the table. The same can be expressed in an equation form as:
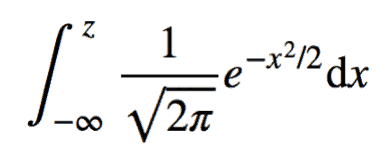
This is then used to create a Z-Table. Since it is not an easy calculation, we will be using Python to calculate it.
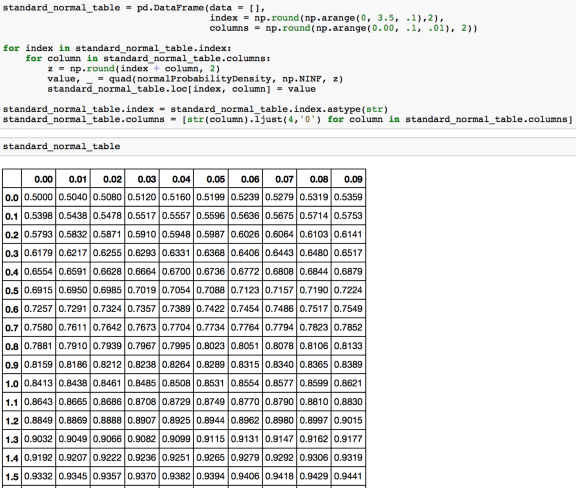
And voila, you have a Z Table! We have successfully created a Z Score Table from scratch. You can also use the above code to create Z Score Tables for values far outside the ones from the usual tables available online but usually the need to do so barely arises.
Hence as you can see, creating a z-table from scratch is both inefficient and unnecessary. It will be both wasteful of our time and energy to create a z table from scratch every time we are to use it. Creating a z-table from scratch does not better help us in any way in solving a problem and so we stick to using Z Score calculators available online or the Z Table available like the one on this website or in textbooks.
References:
https://en.wikipedia.org/wiki/Probability_density_function
https://en.wikipedia.org/wiki/Cumulative_distribution_function
https://www.itl.nist.gov/div898/handbook/eda/section3/eda3671.htm