What is Z Score?
Z score is a fundamental statistical calculation that is used for determining the relationship between the specified data and its dataset values.
Z score indicates the position of a raw score from the mean value of the data set in the standard deviation units. The Z score not only gives the measure of the deviation of an element but also indicates the exact position of the raw score with respect to the mean. Simply put, it is the measure of how many standard deviations below or above a raw element is from the mean.
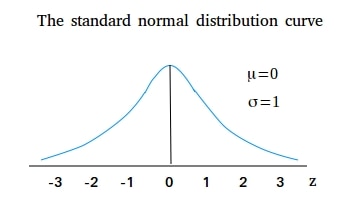
Z score is used to compare the scores of different kinds of variables by standardizing the distribution. Hence it is also known as the standard score. It can be used to standardize the population. Z score can be placed in a standard normal distribution whose mean is zero and the standard deviation is 1.
The z score of a raw score can be positive, negative, or zero.
- If the Z score is zero, it indicates that the raw score is equal to the mean score. That is the score is zero standard deviation away from the mean.
- If the Z score is positive, it indicates that the raw score is above the mean value, to the right of the mean in the SND graph
- negative, it indicates that the raw score is below the mean value, to the left of the mean in the SND graph.
In most cases, the Z score lies within 3 standard deviations below or above the mean.
For the calculation of the Z score, we need to know the mean and standard deviation of the data set.
The mean can be calculated by adding all the elements and dividing it by the total number of the elements.
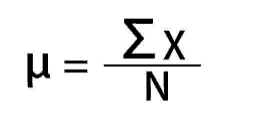
Where
- X = the elements
- N = number of elements
The mean value of a given set of data is defined as the average value. It is calculated by adding the observations and dividing by the total number of observations. Mean is the central value of a set of values.
The standard deviation is the mean of the squared differences of each element from the mean.
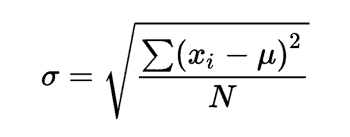
Standard deviation is the square root of the variance. Hence it is the measure of the spread of the dataset with reference to the mean. It is represented by the sigma symbol (σ).
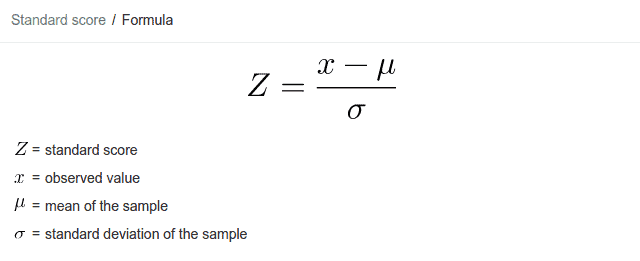
The formula for calculating Z score is :
Calculation of Z score in Excel
We can easily calculate the Z score of an element in MS excel.
Let us take an example and calculate the Z score of an element in excel step by step.
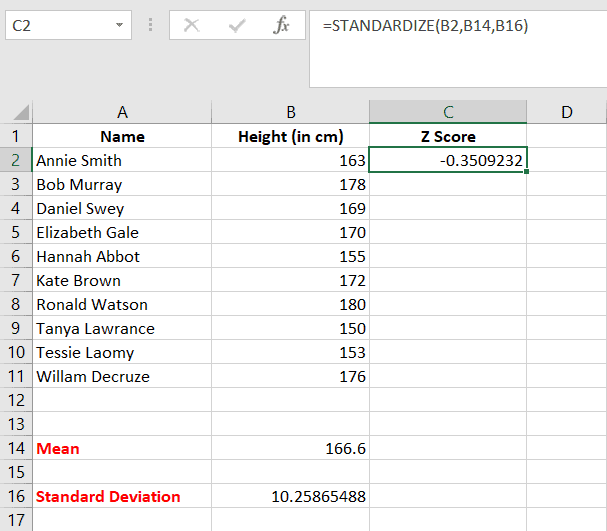
Let us say that the heights of 10 students in a class are given as:
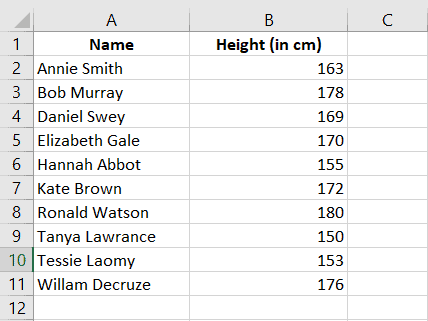
We have to calculate the Z score of the height of each student and tabulate them in column C.
Calculating the mean height
First of all, we have to calculate the mean height of the data set in excel with the following steps:
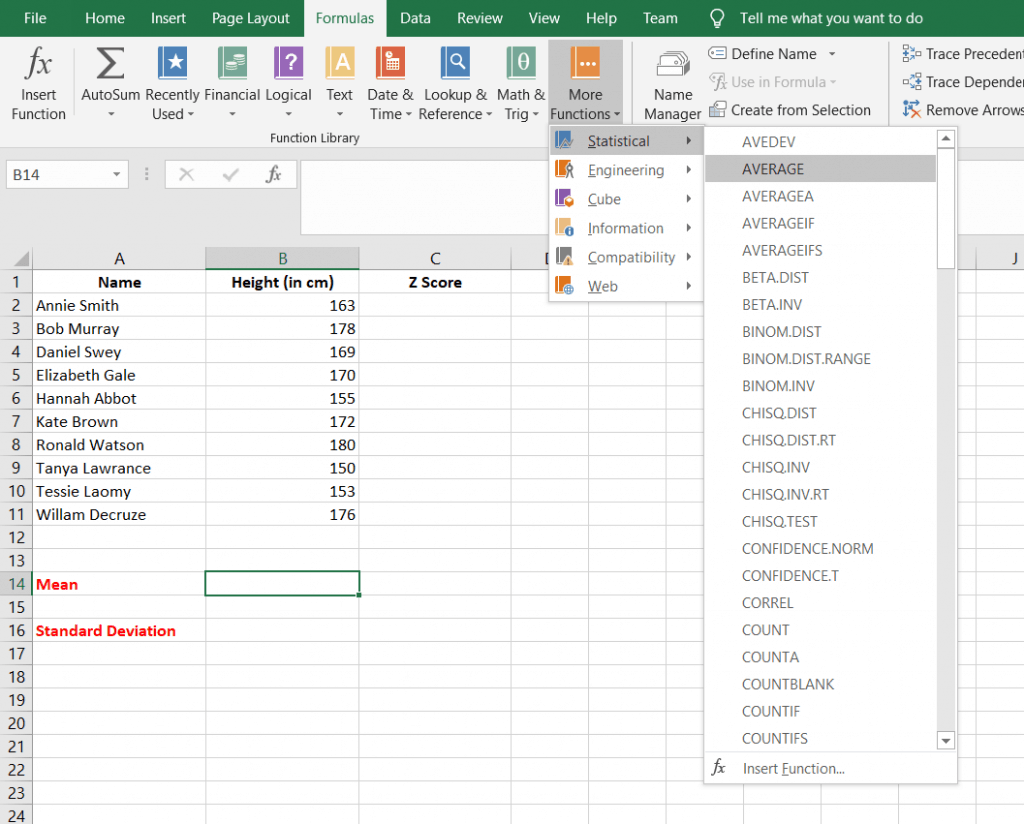
Step 1:
- Select the cell in which the mean value should be displayed.
- The cell selected here for displaying the mean value is B14.
- Then go to Formulas Tab > More Functions > Statistical functions > AVERAGE
- The formulas tab can be seen in the taskbar and when more functions are selected, a drop-down list appears. Select statistical functions from it and again a drop-down list of various statistical functions is listed, Select average from it.
Step 2:
- After step 1, a function argument dialogue box appears.
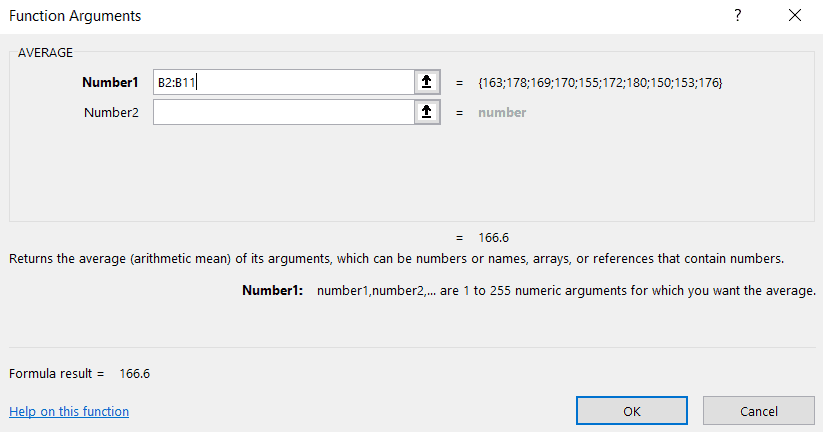
- In the Number1 field, we have to give the range of cells in which the elements are displayed for finding its average.
- In our case, this range of cells is from B2:B11.
- The Number2 field is for the cell in which the mean value to be displayed.
- As we have already selected the cell in step 1, we can leave this blank.
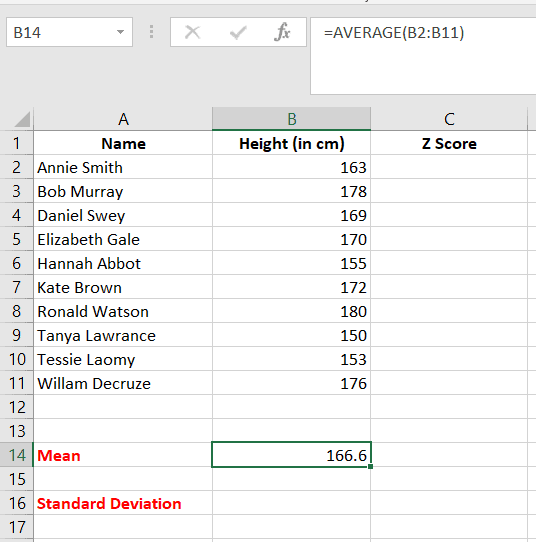
- Click OK. The mean value is displayed on cell B14.
Calculating the standard deviation
Once the mean value is determined, the second step is to find the standard deviation of the data set.
Step 1:
- Select the cell in which the standard deviation value should be displayed.
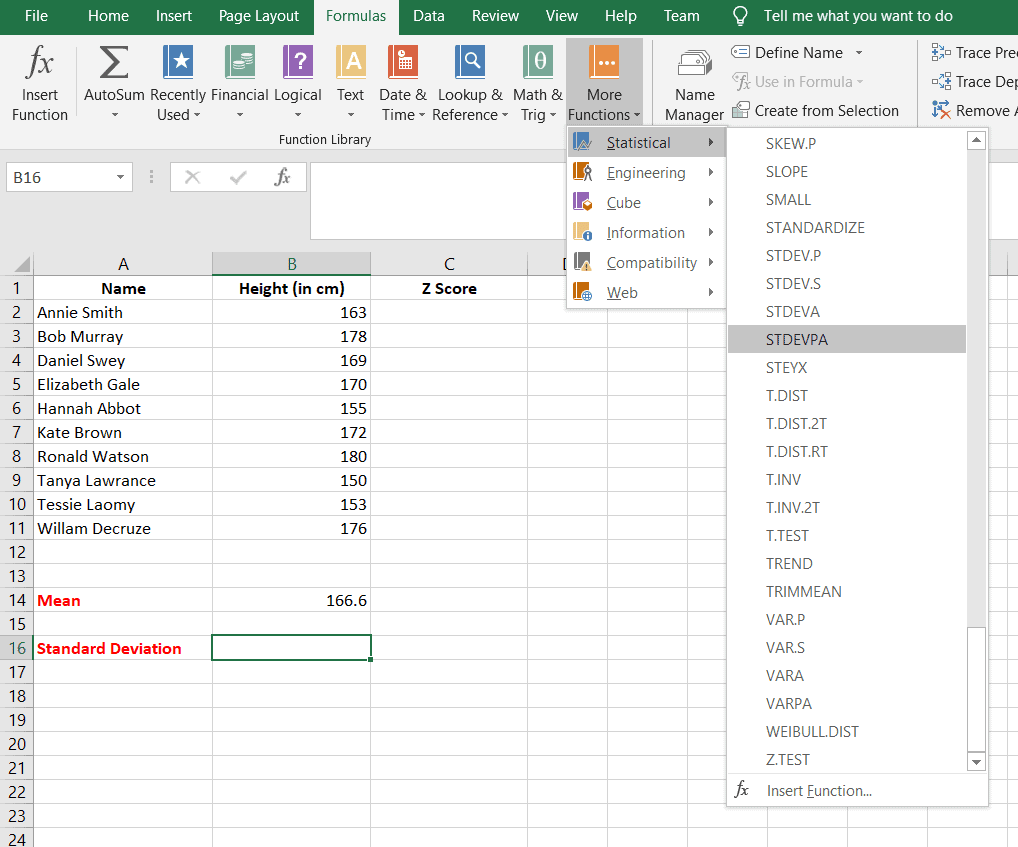
- The cell selected for displaying the standard deviation value is B16.
- Then go to Formulas tab > More Functions > Statistical Functions > STDEVPA
- The STDEVPA function calculates the standard deviation based on an entire population.
Step 2:
- A function argument dialogue box appears similar to the one of the average function.
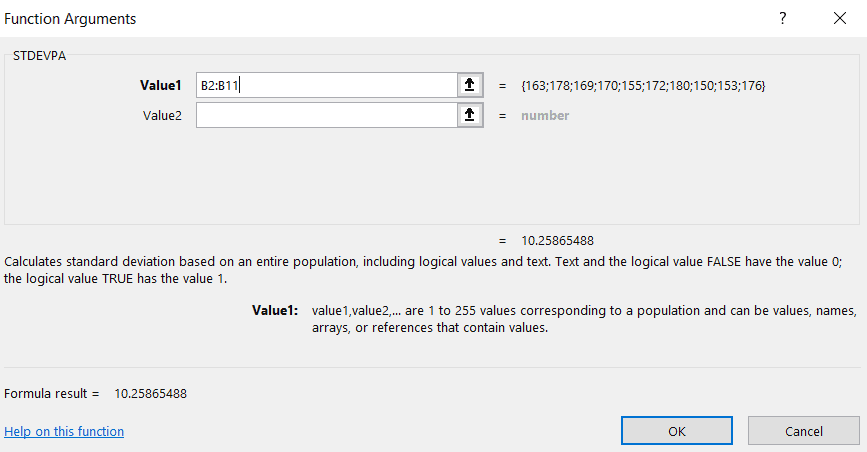
- Give the same cell range, that is from B2:B11 in the Number1 field for finding its standard deviation.
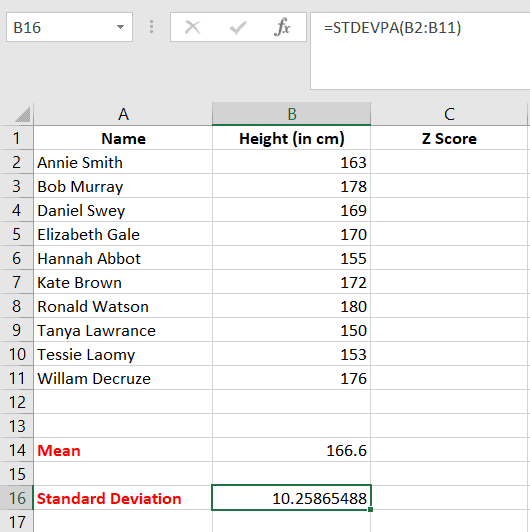
- Once we click OK, the standard deviation value appears in the cell B16.
Calculating Z score
Once the mean value and standard deviation value is known, we can proceed to calculate the Z score of each of the elements.
Step 1:
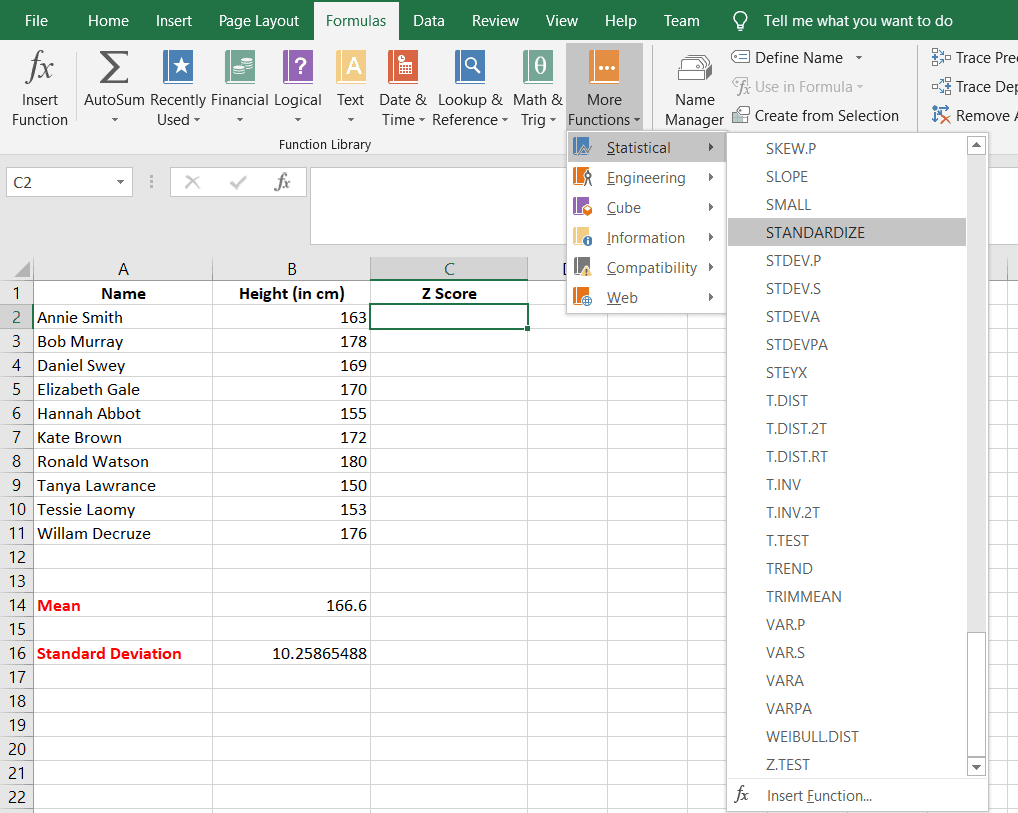
- Select the cell in which the Z score should be displayed.
- Let us take the Z score of the height of Annie Smith. So the cell selected is C2.
- Then go to Functions tab > More Functions > Statistical Functions > STANDARDIZE
- The STANDARDIZE function returns a normalized value from a distribution characterized by a mean and standard deviation.
Step 2:
- A function argument dialogue box appears.
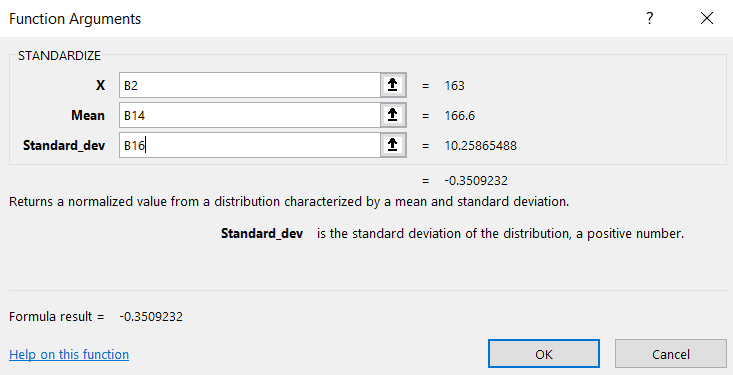
- Here, in the field of X, give the cell in which the height of Annie Smith is displayed. That is cell B2.
- In the Mean field, give the cell number B14.
- But the cell number is given as $B$14.
This is because we have to keep this cell constant for every Z score calculation in this dataset so that we can avoid typing it again and again for each element.
- Similarly, B16, the cell in which the standard deviation is stored is given in the Standard_dev filed as $B$16.
- When we click OK, the Z score of the height of Annie Smith is displayed in cell C2.
Step 3:
Now, we don’t have to repeat the entire process of finding out the Z score of the remaining 9 elements. The cell C2 contains the formula for finding the Z score.
As we have kept the Mean and Standard_dev field constant, we can add this formula to the cells from C3 to C11 by dragging the cell C2 up to C11.
For this:
- Position the mouse at the bottom right corner of the cell where the cursor turns to a + sign.
- Then click it and drag the mouse up to the cell C11.
- The Z score of each element from B3 to B11 will automatically appear in their corresponding cells.
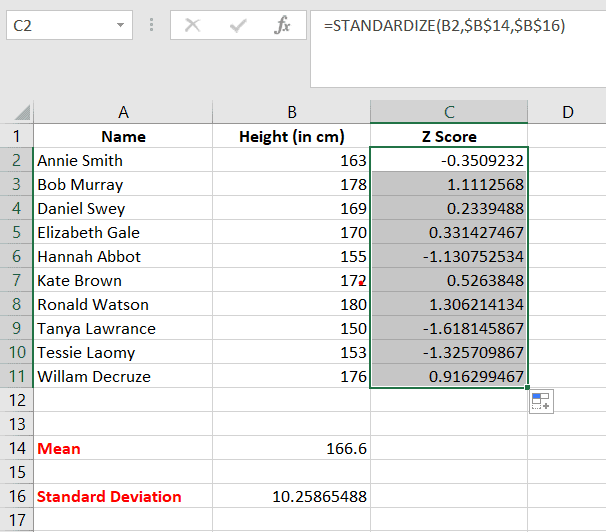
As we can see
- The highest Z score is 1.325709867 corresponding to Ronald Watson. Hence, he is the tallest student in his class.
- The lowest Z score is -1.6218145867 corresponding to Tanya Lawrance. Hence she is the shortest student in her class.
- All those who have a positive Z score have height more than the mean height value and those who have a negative Z score value have a height less than the mean value.
- The student who has height closest to the mean height value is Daniel Swey who has a Z score of 0.2339488