The Altman Z Score is a formula or a model created by Mr. Edward Altman which assesses a companies’ financial stability and predicts how likely a company is to go bankrupt. It lets us predict the financial distress of a company and how high or low the probability is of the company becoming insolvent in near future of about 2 years.
The Altman Z-Score, also referred to as AZ-Score often, is the output of a credit-strength test of a company based on five key financial ratios, namely profitability, leverage, liquidity, solvency and activity, all usually available in the balance sheets or the company’s annual 10-K report.
The formula was originally designed for public manufacturing firms with more $1 Million in assets in 1968 but since has been adapted for non-public manufacturing firms and smaller or private firms with net assets less than $1 Million in net worth
This method of assessing solvency was created by Edward Altman, an American finance expert who wanted to develop a formula that would assess companies’ financial stability.
ALTMAN Z SCORE FORMULA (for public manufacturing companies)
This is the original formula developed by Altman for publicly-held manufacturing companies. The Altman Z Score formula determines the probability that a firm is close to bankruptcy using five key financial ratios of that company namely: profitability, leverage, liquidity, solvency and activity and the formula is given as:
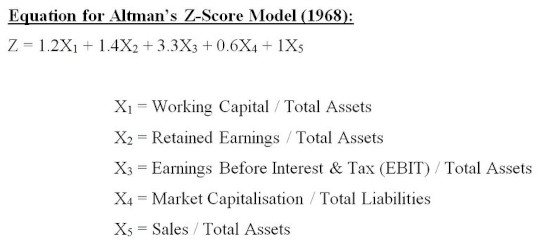
Altman Z Score formula = (1.2 x A) + (1.4 x B) + (3.3 x C) + (0.6 x D) + (0.999 x E)
where:
| Financial ratio used | Formula for the financial ratio | Explanation |
| A | Working capital / total assets | Working capital = Current assets – Current Liability (Measures liability of the firm) |
| B | Retained earnings / total assets | (Measures accumulated profits compared to assets) |
| C | Earnings before interest and taxes (EBIT) /total assets | (Measures how much profit the firms assets are producing) |
| D | The equity’s market value / total assets | The Equity’s Market Value = Market Cap. + Preferred Stock) (Compares the company’s value versus it’s liabilities) |
| E | Total sales / total assets | (Measures how much the company’s assets are producing in sales). |
What The Z Scores Mean
By substituting the required data in the above formula, it will return a value where the higher the Altman Z Score value, the safer the company or less likely to file for bankruptcy it is and the lower the Altman Z Score the higher the odds that the company is in financial distress and going to file for bankruptcy in near future
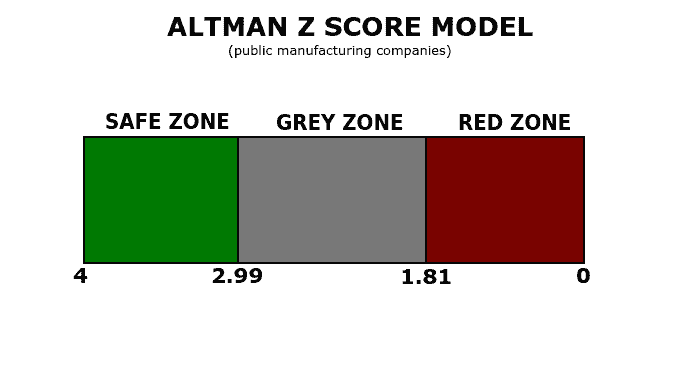
- SAFE ZONE ( Z > 2.99 ) : If the Altman Z Score is over 2.99, the firm is said to be in the ‘Safe Zone’. Which means the company is has a strong financial position and not headed towards bankruptcy in near future.
- GREY ZONE ( 1.81 < Z < 2.99 ) : If the Altman Z Score is between 1.81 and 2.99, the firm is said to be in ‘Grey Zone’ which means it has a moderate probability of bankruptcy in near future. It does not mean that firms lying in this range have a weak financial stability but one needs to be cautious and be diligent of the risks.
- DISTRESS ZONE ( Z < 1.81) : If the Altman Z Score is less than 1.81, then the firm is said to be in ‘Distress Zone’ means the financial position of the company is in a distress and that the company if likely to head towards insolvency in the next two years and files for a bankruptcy.
This helps the investor make a wise choice by cautioning him of the risks of investing in a company which is in the distress or grey zone. The greater the Z Score is, ideally over 3, the more like the investor is to invest in the firm or buy it’s stock because the Z Score over 3 indicates a strong financial position and stability of the firm.
Other versions of the Altman Z Score formula
While the Altman Z Score formula was originally designed for predicting bankruptcy public manufacturing firms with net assets of more than $1 Million, over the next decade or two, Altman adapted his formula to also account for private firms, non-manufacturing firms and well as firms with net assets less than $1 Million in net worth. Each of these formulas are given as:
Altman Z Score formula (private companies)
The Altman Z Score for private companies is given as:
Altman Z Score = (0.717 x A) + (0.847 x B) + (3.107 x C) + (0.420 x D) + (0.998 x E)
where
- A = (Working Capital) / Total Assets
- B = Retained Earnings / Total Assets
- C = Earnings Before Interest and Taxes / Total Assets
- D = Book Value of Equity / Total Liabilities
- E = Sales / Total Assets
and
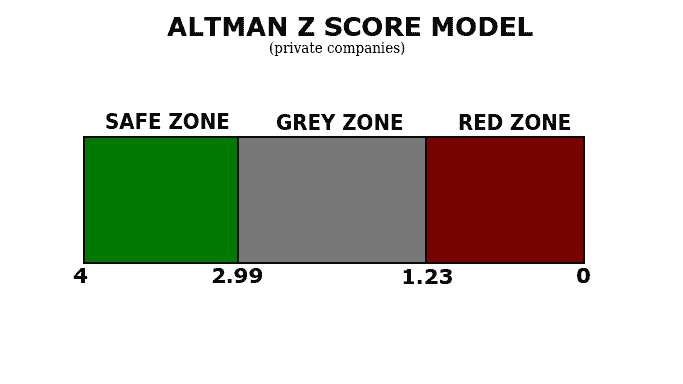
- Safe Zone ( Z > 2.99) : Just like the Altman Z-Score for publicly owned manufacturers, here as well having a Z Score over 2.99 indicates the firm is is solid financial health and has very less likelihood of approaching bankruptcy in the next few years and hence said to be in a ‘Safe Zone’
- Grey Zone ( 2.99 > Z > 1.23) : Here the zones diverge a bit from the previous Z Score model with companies with Z Score between 2.99 to 1.23 in the ‘Grey Zone’ meaning a moderate chance of bankruptcy in the near future and a caution sign for investors
- Distress Zone ( 1.23 > Z) : In the formula for private companies, the distress zone is held for companies showing a Z Score of below 1.23 and such companies are very likely to head towards bankruptcy in the near couple of years and said to be in a poor financial health
Altman Z Score formula (non-manufacturers and companies in emerging markets)
The Altman Z Score was also adapted for non-manufacturing companies and companies in emerging markets. Here the formula diverges quite a lot from the original formula such that only four key ratios are taken into consideration. The sales to assets ratio is taken out and the co-efficients were re-estimated as well.
The formula for each is given below:
Altman Z-Score (non-manufacturers) = (6.56 x A) + (3.26 x B) + (6.72 x C) + (1.05 x D)
Altman Z-Score (emerging markets) = 3.25 + (6.56 x A) + (3.26 x B) + (6.72 x C) + (1.05 x D)
where
- A = Working Capital / Total Assets
- B = Retained Earnings / Total Assets
- C = Earnings Before Interest and Taxes / Total Assets
- D = Book Value of Equity / Total Liabilities
and
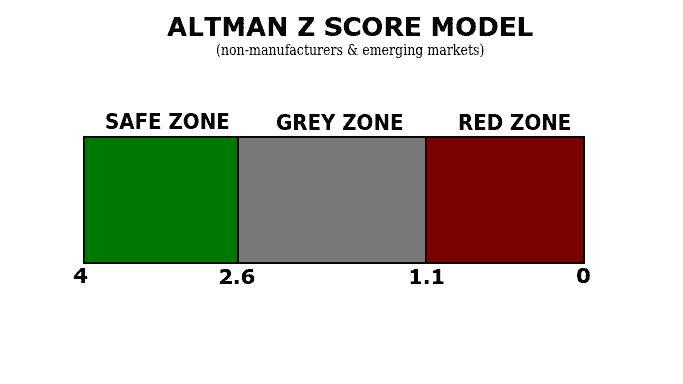
- Safe Zone ( Z > 2.6 ) : Here again the values diverge significantly from the previous formulas with the ‘Safe Zone’ now being assigned to companies with a Z Score over 2.6. Such companies are less likely to head towards bankruptcy and will be considered to be in good financial health
- Grey Zone ( 2.6 > Z > 1.1 ) : The grey zone too is lowered here to values of Z between 2.6 and 1.1. Such companies are considered to be of moderate risk of bankruptcy in both non-manufacturing and companies in emerging markets
- Distress Zone ( 1.1 > Z ) : Here, the distress zone is held for companies with a Z Score value of less than 1.1. Such companies pose a large risk of heading towards bankruptcy in the next couple of years or show a poor financial health
The Five Financial Ratios in Z Score explained
Let us better understand the five financial ratios used in the Z Score better and as to why they are used in the first place.
When Altman was asked as to why he choose these specific financial variables in the model, Altman explained that at the time when the formula was created, there were already a lot of different financial variables into the play to decode the probability of insolvency of a firm. But Altman felt that two very powerful variables that reveal a lot, namely the Retained Value and the market value of the equity relative to the book value of the debt, as opposed to the book value of equity.
The argument for the Retained Value was that although it was not found very much taught in classrooms back then, Altman felt it was a powerful variable that revealed things like measure of the age of a company, the moat or leverage it held, profitability over the life of the company minus dividends and most importantly provided an argument that quoting Altman himself “a firm that has grown its assets mainly by reinvesting earnings is healthier than a firm that has grown the assets by using ‘other people’s money.'”
Let us now understand each of the five key financial ratios that make up the Altman’s Z Score formula in detail and individually.
- Working capital / total assets: To determine the health of a company on a short-term financial health basis, Altman uses the company’s working capital which is the difference between the current assets of a company and it’s current liabilities. Depending on whether the working capital is positive or negative, we get a fair understanding of the growth capacity of the company. In short, this ratio measures the liability of the firm
- Retained earnings / total assets: Similarly, a high retained earnings to total assets ratio shows that the company doesn’t need to be dependent on borrowings and can grow and fund capital expenditure using it’s retained earnings. Whereas a low retained earnings means the financing is being done using borrowed funds. In short, this ratio measures accumulated profits in relation to the assets.
- Earnings before interest and taxes (EBIT) /total assets: Earnings Before Interest and Tax, also known more commonly by it’s abbreviation as EBIT in the financial world, measures the company’s ability to generate profits exclusively from its own operations. Hence, this ratio let’s us know a company’s ability to stay profitable and fund growth in the future. In short, this ratio helps measure how much profit the firms assets are producing
- The equity’s market value / total assets: The market value of equity supplies us with the information of market capitalization or as the name suggests, the value of the company’s equity. To get this detail, we multiply the current price of stocks with the total number of outstanding shares and it helps us understand the degree to which the company’s market value would decline in a case of insolvency before the value of liabilities exceed the value of assets in the balance sheet. A low market value of equity in comparison to the liabilities would indicate a weak investor confidence in the financial strength of the company.
- Total sales / total assets: A high sales to total assets ratio shows us how much the company’s assets are generating in revenues compared to it’s assets. This ratio also shows us the efficiency of the company where a high sales to total assets ratio indicates high profitability and a smaller reliance on investments to generate future sales. Whereas a low sales to total assets ratio indicates higher dependency on resources and investments in future.
Understanding the Altman Z Score by applying it in an example
Now that we’ve understood the Altman Z Score formula, it’s implications and each individual constituent of it, let us better understand the usage of the formula using a sample example.
Example: Let us assume a manufacturer and following data is available in it’s balance sheet: The manufacturer has total assets worth $4,250,000 and a working capital of $4,750,000. Their total liabilities are $5,250,000 and their EBIT is $6,250,000 with a total retained earnings of $700,000 and sales total of $7,250,000. Their total market equity is $6,500,000.
Solution: We have all the data we are looking for in the problem equation. Hence, substituting this in the Altman Z Score, we get:
Altman Z Score = (1.2 x A) + (1.4 x B) + (3.3 x C) + (0.6 x D) + (0.999 x E)
=(1.2 x (4,750,000/4,250,000)) + (1.4 x (700,000/4,250,00)) + (3.3 x (6,250,000/4,250,000)) + (0.6 x (6,500,000/5,250,000)) + (0.999 x (7,250,000/4,250,000))
= 1.34 + 2.3 + 4.85 + 0.74 + 1.68
=10.91
A Z-Score of 10.91 means the company is strongly in the safe zone and that it’s financial position and stability is very strong with no chances of bankruptcy in the near future.
Standard Normal Z Score vs Altman Z Score
Since the two share the same name, it is often a cause of confusion and a common misconception that the Altman Z Score is derived using the standard normal Z Score used in statistics or that the two are related to each other.
The Z Score or standard score used in statistics is a numerical measurement that indicates the number of standard deviations of a value in relationship to the mean. It is the Z Score that tells us if our raw score is below or above the population mean and by how much. Whereas the Altman Z Score helps us predict the financial distress of a company and the probability of it’s bankruptcy in the near future. The two are not related to each other in any way.
Read more about the Z Score
Accuracy, effectiveness, use and criticisms of Altman Z Score Formula
The Altman Z Score has been widely used all over the world to calculate the probabilities of default of their lending portfolios. Similarly a lot of investment firms as well feel the Altman’s formula has done a good job at predicting bankruptcy of firms. The formula is also used widely by hedge funds.
The paper “PREDICTING FINANCIAL DISTRESS OF COMPANIES:
REVISITING THE Z-SCORE AND ZETA®MODELS” published by Edward Altman in July 2000 shows that in initial tests, the formula has an accuracy of 72% in predicting bankruptcy two years before the event, an excellent by even today’s standard making it that much more valuable back then. But in subsequent tests which followed over the next 31 years up until 1999, the formula was actually found to be 80%-90% accurate in predicting bankruptcy one year before the event.
The formula is very helpful to both the investor as well as the firm itself. It also helps the management of distressed companies on whether they should or should not file for bankruptcy. The formula has also been widely used by accountants, database systems, loan evaluators (Eidleman), courts and auditors. The formula is used throughout the world in different contexts.
Altman also believes as he shared in an interview that the formula helped him fairly predict the 2008 crisis and he feels that had the Z Score formula been used instead of credit score ratings, we would have had a much better idea of the imminent meltdown. He feels today as well, we are in a similar bubble waiting to burst with scores being no better than they were in 2007.
However, not all experts and scholars share the same view nor the same level of faith in the Z Score formula with some feeling it’s a largely descriptive statements lacking any predictive content whatsoever. Nor do they feel the Altman formula can be used for financial companies because of the opacity of the companies’ balance sheets and their frequent use of off-balance sheet items
These days the experts and academics prefer relying on market-based data instead of the accounting ratios that Altman uses in his models
History of the Altman Z Score Formula
Altman’s work on Z Score formula was founded or discovered by him from scratch and was based on the work of his predecessors like the accounting researcher William Beaver. William Beaver was the original one to apply the t-test method to predict bankruptcy for a pair-matched sample of firms and hence making him the first to apply a statistical method for the calculation of the same. The way William Beaver carried out his research and formulation was based on univariate analysis by applying this method to evaluate the importance of each individual accounting ratios one at a time.
How Altman built upon and improved this was by applying a statistical method and discriminant analysis which could simultaneously take multiple variables in account. Altman’s work can also said to be a modified version of R.A. Fisher’s work which delved a lot into discriminant analysis techniques.
When asked in an interview as to the background and how Altman came across the problem and developed the formula as a solution, Edward Altman said that when he was a graduate student at UCLA in the 1960s, one of his mentors Professor J. Fred Weston suggested the topic of bankruptcy because he knew Altman was looking for a topic for research. Professor J. Fred Weston wrote a one-word note “bankruptcy” and handed it to Altman. Little did Altman know at the time that his formula would still be in wide use 50 years from then. Because back then back then backruptcy was not considered the most popular sector to research on the research on measures to look at the financial risk of companies was still in it’s infancy.
Altman decided to look at the subject of predicting financial distress of companies using a multivariate approach. He decided to combine a number of financial indicators using discrimant analysis to predict bankruptcy.
Altman humbly credits his breakthrough not to his own brilliance but to timing and luck and feels he was the at the right place and the right time as a PhD student. It was during the mid-1960s that the use of computers was starting to be available widely on the American college campuses and he felt that had he been a student just a few years ago, he might not have had access to the same. But at the same time had he been a student just a few years later, maybe someone else would had done and wrapped up the same work instead of him.
The Altman Z-Score formula was developed by Altman to gauge the state of financial harship experienced by a company and to evaluate it’s stability. This concept of developing a formula for forecasting the probability of banktrupcy of a company played an important role during the Great Depression during which a steep increase in default incidences took place for American businesses.
When initially formulated, the Altman Z Score model was designed for manufacting companies with assests of over $1 Million and did not include private companies, nor non-manufacturing companies, nor publick manufacting companies with assests lower than $1 Million.
However, over the years, the Z-Score Formula was adapted by Edward Altman to suit other types of organizations and asset classes. The model that was designed when devising a weighting system in 1968, let Altman come up with three separate Z-Score models based on different types of business but the first model released in 1968 only catered to public manufacturing companies with assets over $1 Million. It was after a long wait of 15 years that Altman released two other models which applied to non-publicly traded companies as well as smaller private manufacturers and to include more variables and extensive systems
History of Edward Altman
Edward Altman is considered a pioneer in the field of bankruptcy prediction and credit risk management and is credited with the renowned and widely used formula known as the Altman Z Score formula or model which he published in the year 1968 for predicting bankruptcy using statistical method and discriminant analysis.

Altman and his PhD student professor Edith Hotchkiss are also credited with coining the term Chapter 22 which is now popularly referred by companies while filing for bankruptcy more than once. During the same years, that is 1990s, he is also credited with defining the term ‘distressed debt securities’ for bonds which yield more than the ‘risk free’ ten percent provided by government bond rates.
While not much is known about his personal life, it is known that he is the brother of Ellen Altman-Stein who holds an MBA in Special Education and Stuart Altman, a well known health care economist. Born on 5th June, 1941, Edward Altman is currently a professor of Finance, Emeritus at Stern School of Business (New York University). Altman holds a Ph.D in Finance and an MBA from UCLA and a B.A. in Economics from CCNY.
Altman is considered an authority figure in the finance and bankruptcy sector and is a leading academic on Distressed Debt markets, High Yield Debt markts, building models of credit risk management and bankruptcy prediction. Altman also used to teach the same in the Risk Management Open Enrollment program for Stern Executive Education, the TRIUM Global Execute MBA program, HEC School of Management, the (MSGF) Master of Science in Global Finance, the London School of Economics, the (MSRM) Master of Science in Risk Management Program for Executives offered by HKU of Science and Tech and NYU Stern, where he has been a member of the faculty since 1967.
Altman has also recieved many accolades and rightly so for his outstanding contributions. In 2001, he was inducted into the Hall of Fame for The Fixed Income Society and in 2008 in the Hall of Fame for the Turnaround Management as an inaugral inductee. He has recieved also recieved Honorary Doctorates from the Lund University, Sweden in 2011 and the Warsaw School of Economics, Poland in 2014. When it comes to Honorary achievements, Altman was also named as the Honorary Professor by the University of Buenos Aires, Argentina in 1996 and in 2017 by the Vigo University, Spain. He has co-founded the International Risk Management conference in the year 2007 and was also chosen as one the ‘100 Most Influential People in Finance’ by the Treasury of Risk Management magazine in 2005.
Altman has also authored, co-authored or edited over 25 books with the majority of them being primarily in the risk management sector. Some of the key titles being ‘Managing Credit Risk, 2nd Edition. [John Wiley and Sons]’ ‘Corporate Financial Distress and Bankruptcy, 3rd edition. [John Wiley and Sons.]’ and ‘Bankruptcy, Credit Risk and High Yield ‘Junk’ Bonds: A Compendium of Writings. [Oxford, England and Malden, Massachusetts: Blackwell Publishing.]’ to just name a few.
Overall one can say the contribution of Edward Altman’s work to the field of finance and financial education is vast and the finance and risk management sector will be indebted to his work for years to come especially through the use of his Z Score formula which is currently being used and will continue to be used for years to come.
References
http://people.stern.nyu.edu/ealtman/IRMC2014ZMODELpaper1.pdf
http://sersc.org/journals/index.php/IJAST/article/view/21669